Benchmarking Pulsar and Kafka - The Full Benchmark Report - 2020


Get the updated Apache Pulsar vs. Apache Kafka 2022 Benchmark here.
Read below for details on the 2020 Benchmark.
Introduction
Having identified multiple issues in Confluent’s approach to evaluating various performance factors, we decided to repeat their benchmark on Pulsar and Kafka with some adjustments. We wanted to improve the accuracy of the test to facilitate more meaningful comparisons between the two systems. We also wanted to get a more comprehensive view, so we broadened the scope of our test to include additional performance measures and simulated real-world scenarios.
Our benchmark repeated Confluent’s original tests with the appropriate corrections and included all the durability levels supported by Pulsar and Kafka. As a result, we were able to compare throughput and latency at equivalent levels of durability. In addition, we benchmarked new performance factors and conditions, such as varying numbers of partitions, subscriptions, and clients. We also emulated real-world use cases by testing mixed workloads containing writes, tailing-reads, and catch-up reads.
In this report, we describe the tests we performed in detail and share our results and conclusions.
Content
- Maximum Throughput Test
- #1 100 partitions, 1 subscription, 2 producers and 2 consumers
- #2 2000 partitions, 1 subscription, 2 producers and 2 consumers
- #3 1 partition, 1 subscription, 2 producers and 2 consumers
- #4 1 partition, 1 subscription, 1 producer and 1 consumer
- Publish and End-to-End Latency Test
- #1 100 partitions, 1 subscription
- #2 100 partitions, 10 subscriptions
- #3 100, 5000, 8000, 10000 partitions
- Catch-up Read Test
- Mixed Workload Test
- Conclusions
Maximum Throughput Test
The following is the test setup.
We designed this test to determine the maximum throughput Pulsar and Kafka can achieve when processing workloads that consist of publish and tailing-reads. We varied the number of partitions to see how each change impacted throughput. Our test strategy included the following principles and expected guarantees:
- Each message was replicated three times to ensure fault tolerance.
- We varied the number of acknowledgements to determine the maximum throughput of each system under various replication durability guarantees.
- We enabled batching for Kafka and Pulsar, batching up to 1 MB of data for a maximum of 10 ms.
- We tested varying numbers of partitions—specifically, 1, 100, and 2000—to measure the maximum throughput for each condition.
- When benchmarking the maximum throughput for 100 and 2000 partitions, we ran 2 producers and 2 consumers.
- When benchmarking the maximum throughput for a single partition, we varied the number of producers and consumers to measure changes in throughput under different conditions.
- We used a message size of 1 KB.
- For each scenario, we tested the maximum throughput under various durability levels.
The following is the result for each test.
#1 100 partitions, 1 subscription, 2 producers and 2 consumers
Our first test benchmarked maximum throughput on Pulsar and Kafka with 100 partitions under two different durability guarantees. We used one subscription, two producers, and two consumers for each system. Our test results are described below.
- When configured to provide Level-1 durability guarantees (sync replication durability, sync local durability), Pulsar achieved a maximum throughput of ~300 MB/s, which reached the physical limit of the journal disk’s bandwidth. Kafka was able to achieve ~420 MB/s with 100 partitions. It should be noted that when providing level-1 durability, Pulsar was configured to use one disk as journal disk for writes and the other disk as ledger disk for reads, comparing to Kafka use both disks for writes and reads. While Pulsar's setup is able to provide better I/O isolation, its throughput was also limited by the maximum bandwidth of a single disk (~300 MB/s). Alternative disk configurations can be beneficial to Pulsar and allow for more cost effective operation, which will be discussed in a later blog post.
- When configured to provide Level-2 durability guarantees (sync replication durability, async local durability), Pulsar and Kafka each achieved a maximum throughput of ~600 MB/s. Both systems reached the physical limit of disk bandwidth.

Figure 1: Maximum throughput with 100 partitions on Pulsar and Kafka (sync local durability)
Figure 2 shows the maximum throughput on Pulsar and Kafka with 100 partitions under async local durability.

#2 2000 partitions, 1 subscription, 2 producers and 2 consumers
Our second test benchmarked maximum throughput using the same durability guarantees (acks = 2) on Pulsar and Kafka. However, we increased the number of partitions from 100 to 2000. We used one subscription, two producers, and two consumers. Our test results are described below.
- Pulsar’s maximum throughput remained at ~300 MB/s under a Level-1 durability guarantee and increased to ~600 MB/s under Level-2 durability.
- Kafka’s maximum throughput decreased from 600 MB/s (at 100 partitions) to ~300 MB/s when flushing data for each message individually (kafka-ack-all-sync).
- Kafka’s maximum throughput decreased from ~500 MB/s (at 100 partitions) to ~300 MB/s when using the system’s default durability settings (kafka-ack-all-nosync).
To understand why Kafka’s throughput dropped, we plotted the average publish latency for each system under each durability guarantee tested. As you can see in Figure 3, when the number of partitions increased to 2000, Kafka’s average publish latency increased to 200 ms and its 99th percentile publish latency increased to 1200 ms.

Increased publish latency can significantly impact throughput. Latency did not affect throughput on Pulsar because Pulsar clients leverage Netty’s powerful asynchronous networking framework. However, latency did impact throughput on Kafka because Kafka clients use synchronous implementation. We were able to improve throughput on Kafka by doubling the number of producers. When we increased the number of producers to four, Kafka achieved a throughput of ~600 MB/s.
Figure 4 shows the publish latency for Pulsar and Kafka with 2000 partitions.

#3 1 partition, 1 subscription, 2 producers and 2 consumers
Adding more brokers and partitions helps increase throughput on both Pulsar and Kafka. To gain a better understanding of each system’s efficiency, we benchmarked maximum throughput using only one partition. For this test, we used one subscription, two producers, and two consumers.
We observed the following:
- Pulsar achieved a maximum throughput of ~300 MB/s at all levels of durability.
- Kafka achieved a maximum throughput of ~300 MB/s under async replication durability, but only ~160 MB/s under sync replication durability.
Figure 5 shows the maximum throughput on Pulsar and Kafka with one partition under sync local durability.

Figure 6 shows the maximum throughput on Pulsar and Kafka with one partition under async local durability.

#4 1 partition, 1 subscription, 1 producer and 1 consumer
We benchmarked maximum throughput on Pulsar and Kafka using only one partition and one subscription, as in the previous test. However, for this test, we used only one producer and one consumer (instead of two of each).
We observed the following:
- Pulsar sustained a maximum throughput of ~300 MB/s at all durability levels.
- Kafka’s maximum throughput decreased from ~300 MB/s (in Test #3) to ~230 MB/s under async replication durability.
- Kafka’s throughput was dropped from ~160 MB/s (in Test #3) to ~100 MB/s under sync replication durability.
Figure 7 shows the maximum throughput Pulsar and Kafka achieved with one partition, one producer, and one consumer under sync local durability.

To understand why Kafka’s throughput dropped, we plotted the average publish latency (see Figure 8) and end-to-end latency (see Figure 9) for each system under different durability guarantees. As you can see from the graphics below, even with just one partition, Kafka’s publish and end-to-end latency increased from single-digit values to multiple hundreds of milliseconds. Reducing the number of producers and consumers greatly impacted Kafka’s throughput. In contrast, Pulsar consistently offered predictable low single-digit latency.


Publish and End-to-End Latency Test
The following is the test setup.
The test was designed to determine the lowest latency each system can achieve when processing workloads that consist of publish and tailing-reads. We varied the number of subscriptions and the number of partitions to see how each change impacted both publish and end-to-end latency. Our test strategy included the following principles and expected guarantees:
- Each message was replicated three times to ensure fault tolerance.
- We varied the number of acknowledgments to measure variances in throughput using different replication durability guarantees.
- We varied the number of subscriptions (from 1 to 10) to measure latency for each.
- We varied the number of partitions (from 100 to 10000) to measure latency for each.
- We used a message size of 1KB.
- The producer sent messages at a fixed rate of 200000/s (~200 MB/s) and the tailing-read consumers processed the messages while the producer continued to send them.
The following is the result for each test.
#1 100 partitions, 1 subscription
We started with 100 partitions and 1 subscription to benchmark the lowest latency Pulsar and Kafka can achieve under all different durability guarantees.
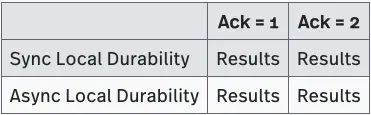
Our test showed Pulsar’s publish and end-to-end latency to be two to five times lower than Kafka’s at all levels of durability. You can see the actual test results in Table 1.

Publish Latency - Sync Local Durability
Figure 10 shows the differences in publish latency between Pulsar and Kafka using two replication durability settings (ack-1 and ack-2, respectively) and sync local durability. Table 2 shows the exact latency numbers for each case. As you can see, Pulsar’s 99th percentile latency is three times lower than Kafka’s under async replication durability (ack-1) and five times lower under sync replication durability (ack-2).


To gain a better understanding of how latency changes over the time, we plotted the 99th percentile publish latency for Pulsar and Kafka using various replication durability settings. As you can see in Figure 11, Pulsar’s latency stayed consistent (~5 ms) but Kafka’s latency was spiky. Stable and consistently low latency is crucial to mission-critical services.

End-to-End Latency - Sync Local Durability
Figure 12 shows the differences in end-to-end latency between Pulsar and Kafka using two replication durability settings (ack-1 and ack-2, respectively) and sync local durability. Table 3 shows the exact latency numbers for each case. As you can see, Pulsar’s 99th percentile end-to-end latency was three times lower than Kafka’s under async replication durability (ack-1) and five times lower under sync replication durability (ack-2).

.webp)
Publish Latency - Async Local Durability
Figure 13 shows the differences in publish latency between Pulsar and Kafka using two replication durability settings (ack-1 and ack-2, respectively) and async local durability. Table 4 shows the exact latency numbers for each case. As you can see, Kafka performed better in the async replication durability (ack-1) case. But Pulsar’s 99th percentile publish latency stayed consistent (below 5 ms) and increasing the replication durability guarantee (from ack-1 to ack-2) did not impact latency. However, Kafka’s 99th percentile publish latency with sync replication durability (ack-2) was much higher than Pulsar’s.


To gain a better understanding of how publish latency changes over the time, we plotted the 99th percentile publish latency for Pulsar and Kafka under various replication durability settings. As you can see in Figure 14, Pulsar’s latency stayed consistently low (below 5 ms) and Kafka’s was about two times of Pulsar’s with sync replication durability.

End-to-End Latency - Async Local Durability
Figure 15 shows the differences in end-to-end latency between Pulsar and Kafka under two replication durability settings (ack-1 and ack-2, respectively) and async local durability. Table 5 shows the exact latency numbers for each case. As you can see, Pulsar performed consistently better than Kafka in all cases. Pulsar’s 99th percentile end-to-end latency stayed consistent (~ 5 ms) and varying the replication durability setting had no impact. Kafka’s 99th percentile end-to-end latency was 1.5 times higher than Pulsar’s for ack-1 and 2 times higher for ack-2.

.webp)
#2 100 partitions, 10 subscriptions
Once we understood how Pulsar and Kafka performed with just one subscription, we wanted to see how varying the number of subscriptions affected publish and end-to-end latency. So, we increased the number of subscriptions from 1 to 10 and assigned 2 consumers to each subscription.
As you can see from the details in Table 6, our test results showed the following:
- Pulsar’s 99th percentile publish and end-to-end latency stayed between 5 and 10 ms.
- Kafka’s 99th percentile publish and end-to-end latency were greatly impacted by increasing the number of subscriptions and went up to multiple seconds.

Publish Latency: Sync Local Durability
Figure 16 shows the differences in publish latency between Pulsar and Kafka under two replication durability settings (ack-1 and ack-2, respectively) and sync local durability. Table 7 shows the exact latency numbers for each case. As you can see, Pulsar’s 99th percentile publish latency was still three times lower than Kafka’s under async replication durability (ack-1). But under sync replication durability (ack-2), Pulsar’s publish latency was 160 times lower than Kafka’s (as compared to 5 times lower with only one subscription).


End-to-End Latency - Sync Local Durability
Figure 17 shows the differences in end-to-end latency between Pulsar and Kafka under two replication durability settings (ack-1 and ack-2, respectively) and sync local durability. Table 8 shows the exact latency numbers for each case. As you can see, Pulsar’s 99th percentile latency was 20 times lower than Kafka’s under async replication durability (ack-1) and 110 times lower under sync replication durability (ack-2).


Publish Latency - Async Local Durability
Figure 18 shows the differences in publish latency between Pulsar and Kafka under two replication durability settings (ack-1 and ack-2, respectively) and async local durability. Table 9 shows the exact latency numbers for each case. As you can see, Pulsar outperformed Kafka significantly. Pulsar’s average publish latency was ~3 ms and its 99th percentile latency was within 5 ms. Kafka’s performance was satisfactory under async replication durability (ack-1), but significantly worse under sync replication durability (ack-2). Kafka’s 99th percentile publish latency under sync replication durability was 270 times higher than Pulsar’s.

.webp)
End-to-End Latency - Async Local Durability
Figure 19 shows the differences in end-to-end latency between Pulsar and Kafka under two replication durability settings (ack-1 and ack-2, respectively) and async local durability. Table 10 shows the exact latency numbers for different cases. As you can see, Pulsar performed consistently better than Kafka in all cases. Pulsar’s end-to-end latency consistently stayed between 4 and 7 ms and varying the replication durability setting had no impact. Kafka’s 99th percentile end-to-end latency was 13 times higher than Pulsar’s for ack-1 and 187 times higher for ack-2.


#3 100, 5000, 8000, 10000 partitions
Having learned how varying the number of subscriptions affects publish latency in both Pulsar and Kafka, we wanted to vary the number of partitions and observe the effects. So, we increased the number of partitions in increments from 100 to 10000 and looked for changes.
As you can see from the details in Table 11, our test results showed the following:
- Pulsar’s 99th percentile publish latency remained stable at ~5 ms when the number of partitions increased.
- Kafka’s 99th percentile publish latency was greatly impacted by incremental increases in the number of partitions and went up to multiple seconds.
- When the number of partitions exceeded 5000, Kafka’s consumer was unable to keep up with the publish throughput.
Ack = 1, Sync local durability
Figure 20 and Figure 21 show the differences in publish and end-to-end latency, respectively, between Pulsar and Kafka when varying the number of partitions under sync local durability and async replication durability (ack = 1).


Figure 22 shows end-to-end latency with varying numbers of partitions and one acknowledgment on Pulsar. Figure 23 shows end-to-end latency with varying numbers of partitions and one acknowledgement on Kafka.


As you can see from the figures and tables above,
- Pulsar’s 99th percentile publish latency remained stable at ~5 ms. Varying the number of partitions had no effect.
- Pulsar’s 99th percentile end-to-end latency remained stable at ~6 ms. Varying the number of partitions had no effect.
- Kafka’s 99th percentile publish latency degraded incrementally as the number of partitions increased and was 5 times higher at 10000 partitions (as compared to 100). This was 10 times higher than Pulsar’s.
- Kafka’s 99th percentile end-to-end latency degraded incrementally as the number of partitions increased and was 10000 times higher at 10000 partitions (as compared to 100). Kafka’s 99th percentile end-to-end latency at 10000 partitions increased to 180 s and was 280000 times higher than Pulsar’s.
Ack = 2, Sync local durability
Figure 24 shows the differences in publish latency between Pulsar and Kafka when varying the number of partitions under sync local durability and sync replication durability (ack = 2). Table 14 shows the exact latency numbers for each case.


Figure 25 and Figure 26 show how varying the number of partitions affects end-to-end latency in Pulsar and Kafka, respectively.


As you can see from the figures and tables above,
- Pulsar’s 99th percentile publish latency remained stable at ~10 ms. Increasing the number of partitions had no effect. Kafka’s 99th percentile publish latency degraded incrementally as the number of partitions increased and was 30 times higher at 10000 partitions (as compared to 100). Kafka’s 99th percentile publish latency at 10000 partitions increased to 1.7 s and was 126 times higher than Pulsar’s.
- Pulsar’s 99th percentile end-to-end latency remained stable at ~10 ms. Increasing the number of partitions had only a slight impact on Pulsar’s 99th percentile end-to-end latency. But even at 10000 partitions, it remained relatively low at ~50 ms.
- Kafka’s 99th percentile end-to-end latency degraded incrementally as the number of partitions increased. At 10000 partitions, - Kafka’s 99th percentile end-to-end latency increased to 200 s and was 14771 times higher than Pulsar’s.
Ack = 1, Async local durability
Figure 27 shows the publish latency difference between Pulsar and Kafka when varying the number of partitions under async local durability and async replication durability (ack = 1). Table 15 shows the exact latency numbers for different cases.


Figure 28 and Figure 29 show how varying the number of partitions affected end-to-end latency in Pulsar and Kafka, respectively.


As you can see from the above figures and tables,
- Pulsar’s 99th percentile publish latency remained stable at ~4 to ~5 ms. Increasing the number of partitions had no impact.
- Kafka’s 99th percentile publish latency degraded incrementally as the number of partitions increased and was 13 times higher at 10000 partitions (as compared to 100). Kafka’s 99th percentile publish latency at 10000 partitions increased to 41 ms and was 8 times higher than Pulsar’s.
- Pulsar’s 99th percentile end-to-end latency remained stable at ~4 to ~6 ms. Increasing the number of partitions had a slight impact on Pulsar’s 99.9th percentile end-to-end latency but, even at 10000 partitions, it stayed relatively low (within 24 ms).
- Kafka’s 99th percentile end-to-end latency degraded incrementally as the number of partitions increased. At 10000 partitions, Kafka’s 99th percentile end-to-end latency went up to 180 s and was 34416 times higher than Pulsar’s.
Ack = 2, Async local durability
Figure 30 shows the differences in publish latency between Pulsar and Kafka when varying the number of partitions under async local durability and sync replication durability (ack = 2). Table 16 shows the exact latency numbers for each case.


Figure 31 and Figure 32 show how varying the number of partitions affected end-to-end latency on Pulsar and Kafka, respectively.


As you can see:
- Pulsar’s 99th percentile publish latency remained stable at ~4 to ~5 ms. Increasing the number of partitions had no impact.
- Kafka’s 99th percentile publish latency degraded incrementally as the number of partitions increased and was 202 times higher at 10000 partitions (as compared to 100). At 10000 partitions, Kafka’s 99th percentile publish latency increased to 1.7 s and was 278 times higher than Pulsar’s.
- Pulsar’s 99th percentile end-to-end latency remained stable at ~4 to ~6 ms. Increasing the number of partitions had a slight impact on Pulsar’s 99.9th percentile end-to-end latency, but it remained relatively low within 28 ms.
- Kafka’s 99th percentile end-to-end latency degraded incrementally as the number of partitions increased. At 10000 partitions, Kafka’s 99th percentile end-to-end latency increased to 200 s and was 32362 times higher than Pulsar’s.
Catch-up Read Test
The following is the test setup.
The test was designed to determine the maximum throughput Pulsar and Kafka can achieve when processing workloads that contain catch-up reads only. Our test strategy included the following principles and expected guarantees:
- Each message was replicated three times to ensure fault tolerance.
- We varied the number of acknowledgements to measure changes in throughput under various replication durability guarantees.
- We enabled batching on Kafka and Pulsar, batching up to 1 MB of data for a maximum of 10 ms.
- We benchmarked both systems with 100 partitions.
- We ran a total of four clients—two producers and two consumers.
- We used a message size of 1 KB.
At the beginning of the test, the producer started sending messages at a fixed rate of 200 K/s. When 512 GB of data had accumulated in a queue, the consumers began processing. The consumers first read the accumulated data from beginning to end, and then went on to process incoming data as it arrived. The producer continued to send messages at the same rate for the duration of the test.
We evaluated how quickly each system was able to read the 512 GB of backlog data. We compared Kafka and Pulsar under different durability settings.
The following is the result for each test.
#1 Async local durability with Pulsar’s journal bypassing feature enabled
In this test, we used equivalent async local durability guarantees on Pulsar and Kafka. We enabled Pulsar’s new journal bypassing feature to match the local durability guarantee provided by Kafka’s default fsync settings.
As you can see from our results shown in Figure 33 below,
- Pulsar’s maximum throughput reached 3.7 million messages/s (3.5 GB/s) when processing catch-up reads only.
- Kafka’s only reached a maximum throughput of 1 million messages/s (1 GB/s).
- Pulsar processed catch-up reads 75% faster than Kafka.

#2 Async local durability with Pulsar’s journal bypassing feature disabled
In this test, we used async local durability guarantees on Pulsar and Kafka, but disabled Pulsar’s journal bypassing feature.
As you can see from our results shown in Figure 34 below,
- Pulsar’s maximum throughput when processing catch-up reads reached 1.8 million messages/s (1.7 GB/s).
- Kafka only reached a maximum throughput of 1 million messages/s (1 GB/s).
- Pulsar processed catch-up reads twice as fast as Kafka.

#3 Sync local durability
In this test, we compared Kafka and Pulsar under equivalent sync local durability guarantees.
As you can see from our results shown in Figure 35 below,
Pulsar’s maximum throughput reached 1.8 million messages/s (1.7 GB/s) when processing catch-up reads only. Kafka only reached a maximum throughput of 1 million messages/s (1 GB/s). Pulsar processed catch-up reads twice as fast as Kafka.

Mixed Workload Test
The following is the test setup.
This test was designed to evaluate how catch-up reads affect publish and tailing-reads in mixed workloads. Our test strategy included the following principles and expected guarantees:
- Each message was replicated three times to ensure fault tolerance.
- We enabled batching for Kafka and Pulsar, batching up to 1 MB of data for a maximum of 10 ms.
- We benchmarked both systems with 100 partitions.
- We compared Kafka and Pulsar under different durability settings.
- We ran a total of four clients—two producers and two consumers.
- We used a message size of 1 KB.
At the beginning of the test, both producers started sending data at a fixed rate of 200 K/s and one of the two consumers began processing tailing-reads immediately. When 512 GB of data had accumulated in a queue, the other (catch-up) consumer began reading the accumulated data from beginning to end, and then went on to process incoming data as it arrived. For the duration of the test, both producers continued to publish at the same rate and the tailing-read consumer continued to consume data at the same rate.
The following is the result for each test.
#1 Async local durability with Pulsar enabled bypass-journal feature
In this test, we compared Kafka and Pulsar with equivalent async local durability guarantees. We enabled Pulsar’s new journal bypassing feature to match the local durability guarantee provided by Kafka’s default fsync settings.
As you can see in Figure 36 below, catch-up reads caused significant write delays in Kafka, but had little impact on Pulsar. Kafka’s 99th percentile publishing latency increased to 1-3 seconds while Pulsar’s remained steady at several milliseconds to tens of milliseconds.

#2 Async local durability with Pulsar’s journal bypassing feature disabled
In this test, we used async local durability guarantees on Pulsar and Kafka, but disabled Pulsar’s journal bypassing feature.
As you can see in Figure 37 below, catch-up reads caused significant write delays on Kafka, but had little impact on Pulsar. Kafka’s 99th percentile publishing latency increased to 2-3 seconds while Pulsar’s remained steady at several milliseconds to tens of milliseconds.

#3 Sync local durability
In this test, we compared Kafka and Pulsar with equivalent sync local durability guarantees.
As you can see in Figure 38 below, catch-up reads caused significant write delays on Kafka, but had little impact on Pulsar. Kafka’s 99th percentile publishing latency increased to ~1.2 to ~1.4 seconds while Pulsar’s remained steady at several milliseconds to tens of milliseconds.

Conclusions
Below is a summary of our findings based on the results of our benchmark.
- After the configuration and tuning errors were corrected, Pulsar matched the end-to-end latency Kafka had achieved in Confluent’s limited use case.
- Under equivalent durability guarantees, Pulsar outperformed Kafka in workloads that simulated real-world use cases.
- Pulsar delivered significantly better latency and better I/O isolation than Kafka in every test, regardless of the durability guarantee settings used or the numbers of subscriptions, partitions, or clients specified.

Newsletter
Our strategies and tactics delivered right to your inbox