Overview
Pulsar Functions are Apache Pulsar’s serverless compute framework. By default, a Pulsar Function runs as a single instance. If you want to run a function as multiple instances, you need to specify the parallelism of a function (i.e., the number of instances to run) when creating it. When you want to adjust the number of running instances, you need to collect metrics to see if the scaling is needed and then manually update the parallelism. However, this manual process is unnecessary if you run Puslar Functions in Kubernetes using Function Mesh.
Function Mesh is a Kubernetes operator that enables you to run Pulsar Functions and connectors natively on Kubernetes, unlocking the full power of Kubernetes’ application deployment, scaling, and management. For example, Function Mesh leverages Kubernetes’ scheduling functionality, which ensures that functions are resilient to failures and can be scheduled properly at any time.
With Kubernetes Horizontal Pod Autoscaler (HPA), Function Mesh can automatically scale the number of instances required for Pulsar Functions. For functions with HPA configured, the HPA controller monitors the function's Pods and adds or removes Pod replicas when needed.
There are two approaches to auto-scaling with Function Mesh. The first approach is using the predefined auto-scaling policies provided by Function Mesh, which are based on CPU and memory use. We recommend this easy-to-implement approach if your use case only needs CPU and memory as HPA indicators. (This blog doesn’t cover this approach. You can read the documentation to learn about it.)
The second approach is to customize the auto-scaling policies based on Pulsar Functions' metrics. This approach is more complex to implement, but it allows you to customize HPA according to your use case. (This feature was released with Function Mesh 0.1.7 in June 2021.) The predefined metrics help determine the workload and status of function instances. Pulsar Functions exposes metrics in Prometheus format, and we can make the metrics available to HPA through the Kubernetes Custom Metrics API to support metrics-based auto-scaling.
This blog shows you step-by-step how to enable auto-scaling for Pulsar Functions with custom metrics by (1) defining maxReplicas in Function Custom Resource to enable the HPA controller and (2) customizing autoScalingMetrics to specify the metrics list.
Before You Begin
Review the following notes before starting this tutorial.
- Kubernetes v1.17 ~ v1.21
- HPA v2beta2 was released in Kubernetes version v1.12.
- Apache Pulsar and Prometheus metrics adapter require Kubernetes version v1.14+.
- The apiextensions.k8s.io/v1beta1 API version of CustomResourceDefinition is no longer served as of v1.22, and Function Mesh has not been moved to apiextensions.k8s.io/v1 yet.
- This tutorial is based on Kubernetes v1.20.
- Apache Pulsar 2.8+
- In order to test the function instance with actual workloads, you need a ready-to-use Apache Pulsar cluster.
- This tutorial uses Helm charts from StreamNative (streamnative/charts) to deploy Apache Pulsar to Kubernetes clusters.
- Function Mesh v0.1.9
- Prometheus (deployed with Apache Pulsar and Function Mesh)
- This tutorial uses kube-prometheus to install the cluster-scoped prometheus and uses the Prometheus to collect, store, and query metrics.
- Prometheus Metrics Adapter
- This tutorial uses the Prometheus metrics adapter to expose Prometheus metrics as Custom Metrics to the Kubernetes API server. You can use other APIservices that provide custom-metrics APIs.
- You can deploy the Prometheus Metrics Adapter with kube-prometheus by enabling custom-metrics.libsonnet in kube-prometheus configs. To find more details, please check out Customizing Kube-Prometheus.
Steps
The following steps assume you are starting with a Kubernetes cluster without any service deployed yet.
1. Install the prerequisites
- Download and install Helm3
- Install Apache Pulsar
- Install Function Mesh
- Install kube-prometheus
- Install Prometheus Metrics Adapter
2. Create ServiceMonitor to collect metrics from Pulsar Functions
Function Mesh creates a Service that binds to each Function. The ServiceMonitor from Prometheus-operator monitors the Service and collects the metrics from the Pulsar Function via the Service. In order to create a ServiceMonitor that monitors Pulsar Functions, create a YAML file (shown as below) and apply the file to Kubernetes by kubectl apply -f sample-pulsar-functions-service-monitor.yaml.
- sample-pulsar-functions-service-monitor.yaml:
apiVersion: monitoring.coreos.com/v1
kind: ServiceMonitor
metadata:
  name: function-monitor
  namespace: default
spec:
  endpoints:
    - path: /metrics
      port: "metrics"
  selector:
    matchLabels:
      app: function-mesh
      component: function
  podTargetLabels:
    - component
    - pulsar-component
    - pulsar-namespace
    - pulsar-tenant
    - pulsar-cluster
    - name
    - app
After applying the ServiceMonitor to Kubernetes, you can check the resource with kubectl get servicemonitor.
$ kubectl get servicemonitor
NAME               AGE
function-monitor   7s
3. Configure prometheus-metrics-adapter and add seriesQuery to expose Pulsar Function metrics as custom metrics
The default adapter configuration does not expose Pulsar Function metrics, so we need to add some custom configs to the adapter configuration file by editing the ConfigMap of the adapter.
Function Mesh creates a function's container with the name pulsar-function, and the metrics from the Pulsar Function are strats with pulsar_function_. We add the configs below to the adapter’s config and expose Pulsar Function metrics as custom metrics.
- "seriesQuery": "{__name__=~\"^pulsar_function_.*\",container=\"pulsar-function\",namespace!=\"\",pod!=\"\"}"
  "metricsQuery": "sum(>{>}) by (>)"
  "resources":
    "template": ">"
When you install the Prometheus metrics adapter, a ConfigMap for Prometheus metrics adapter will be created with the same name as the adapter’s deployment name. You can get the ConfigMap name with kubectl get configmap.
$ kubectl get configmap -n monitoring
NAME                                                  DATA   AGE
adapter-config                                        1      65m
…
As shown in the example above, you need to edit the ConfigMap named adapter-config and append the seriesQuery to the config.yaml. After you run the kubectl edit command, the ConfigMap will be open with your system’s default editor, like vi or nano. You can complete the edit and save as usual, and the changes will automatically apply to the Kubernetes cluster.
kubectl edit configmap prometheus-adapter -o yaml
Note that the custom rule maps all Prometheus metrics starting with “pulsarfunction” from container “pulsar-function” to the custom metrics in Kubernetes.
4. Deploy a Function
We use a sample UserMetricFunction from Apache Pulsar and add a user defined metrics LetterCount.
public class UserMetricFunction implements Function {
    @Override
    public Void process(String input, Context context) {
        context.recordMetric("LetterCount", input.length());
        return null;
    }
}
To deploy the function to Function Mesh, create a YAML file as shown below and apply it to the Kubernetes cluster with kubectl apply.
apiVersion: compute.functionmesh.io/v1alpha1
kind: Function
metadata:
  labels:
    pulsar-cluster: pulsar
    pulsar-component: metrics-hpa-java-fn
    pulsar-namespace: default
    pulsar-tenant: public
  name: metrics-hpa-java-fn
  namespace: default
spec:
  className: org.apache.pulsar.functions.api.examples.UserMetricFunction
  cleanupSubscription: true
  clusterName: pulsar
  forwardSourceMessageProperty: true
  image: streamnative/pulsar-all:2.8.1.29
  input:
    sourceSpecs:
      persistent://public/default/metrics-hpa-java-fn-input:
        isRegexPattern: false
        schemaProperties: {}
    topics:
    - persistent://public/default/metrics-hpa-java-fn-input
    typeClassName: java.lang.String
  java:
    extraDependenciesDir: /pulsar/instances/deps
    jar: /pulsar/examples/api-examples.jar
  output:
    producerConf:
      maxPendingMessages: 0
      maxPendingMessagesAcrossPartitions: 0
      useThreadLocalProducers: false
    typeClassName: java.lang.Void
  pod:
    labels:
      pulsar-cluster: pulsar
      pulsar-component: metrics-hpa-java-fn
      pulsar-namespace: default
      pulsar-tenant: public
    autoScalingMetrics:
    - type: Pods
      pods:
        metric:
          name: pulsar_function_received_total_1min
          selector:
            matchLabels:
              pulsar_cluster: pulsar
              pulsar_component: metrics-hpa-java-fn
              pulsar_namespace: default
              pulsar_tenant: public
        target:
          type: AverageValue
          averageValue: "1"
  pulsar:
    pulsarConfig: pulsar-function-mesh-config
  replicas: 1
  maxReplicas: 10
  resources:
    limits:
      cpu: "1"
      memory: "1181116006"
    requests:
      cpu: "1"
      memory: "1073741824"
  retainKeyOrdering: false
  retainOrdering: false
The Pulsar Function instance automatically enables Prometheus collecting and uses pulsar_function_received_total_1min from autoScalingMetrics as the custom metrics. To enable auto-scaling, set a maxReplicas larger than 1.
After the function is deployed, you can see a StatefulSet, a Service, and a HPAv2beta2 instance all with the metrics-hpa-java-fn prefix.
The HPA then uses Pulsar Function’s metrics pulsar_function_received_total_1min and scales the function up when the average value of the metrics is larger than 1. You can customize the HPA rule in autoScalingMetrics as well.
Note: We set the average value as 1 so we can observe autoscaling easily.
To learn more about HPA with Function Mesh, please read the Scaling section of the Function Mesh documentation.
5. Validate the metrics
After the function is ready and running, Prometheus starts collecting metrics from the function’s Pod, and the custom metrics API should show up in discovery. You can then try fetching the discovery information for it:
$ kubectl get --raw /apis/custom.metrics.k8s.io/v1beta1
Because we have set up Prometheus to collect Pulsar Functions' metrics, you should see a pods/pulsar_function_received_total_1min resource show up, and you can then use the kubectl command below to query the Custom Metrics from the Kubernetes API.
$ kubectl get --raw /apis/custom.metrics.k8s.io/v1beta1/namespaces/default/pods/*/pulsar_function_received_total_1min | jq --color-output
{
  "kind": "MetricValueList",
  "apiVersion": "custom.metrics.k8s.io/v1beta1",
  "metadata": {
    "selfLink": "/apis/custom.metrics.k8s.io/v1beta1/namespaces/default/pods/%2A/pulsar_function_received_total_1min"
  },
  "items": [
    {
      "describedObject": {
        "kind": "Pod",
        "namespace": "default",
        "name": "metrics-hpa-java-fn-function-0",
        "apiVersion": "/v1"
      },
      "metricName": "pulsar_function_received_total_1min",
      "timestamp": "2022-01-06T01:16:12Z",
      "value": "0",
      "selector": null
    }
  ]
}
When you can obtain the metrics from the above command from the custom metrics API, the HPA will be ready and you can observe the related metrics.
$ kubectl get hpa
NAME                           REFERENCE                      TARGETS   MINPODS   MAXPODS   REPLICAS   AGE
metrics-hpa-java-fn-function   Function/metrics-hpa-java-fn   0/1       1         10        1          23h

$ kubectl describe hpa metrics-hpa-java-fn-function
Name:                                             metrics-hpa-java-fn-function
Namespace:                                        default
Labels:                                           app=function-mesh
                                                  component=function
                                                  name=metrics-hpa-java-fn
                                                  namespace=default
Annotations:
CreationTimestamp:                                Wed, 05 Jan 2022 10:15:07 +0800
Reference:                                        Function/metrics-hpa-java-fn
Metrics:                                          ( current / target )
  "pulsar_function_received_total_1min" on pods:  0 / 1
Min replicas:                                     1
Max replicas:                                     10
Function pods:                                    1 current / 1 desired
Conditions:
  Type            Status  Reason            Message
  ----            ------  ------            -------
  AbleToScale     True    ReadyForNewScale  recommended size matches current size
  ScalingActive   True    ValidMetricFound  the HPA was able to successfully calculate a replica count from pods metric pulsar_function_received_total_1min
  ScalingLimited  True    TooFewReplicas    the desired replica count is less than the minimum replica count
From the kubectl describe we can see the condition of the HPA is AbleToScale and ScalingActive, which means the HP is ready for you to use.
6. Generate some load to function
We can create a sample producer that generates a large number of messages to the function’s input topic. Below is a sample producer.
public class LoadProducer {
    public static void main(String[] args) throws PulsarClientException {
        PulsarClient client = PulsarClient.builder()
                .serviceUrl("http://localhost:8080")
                .build();

        Producer producer = client.newProducer()
                .topic("persistent://public/default/metrics-hpa-java-fn-input")
                .create();

        for(int i = 0; i
While the producer is running, we can move to the next step to verify the HPA status.
7. Monitoring the auto-scaling
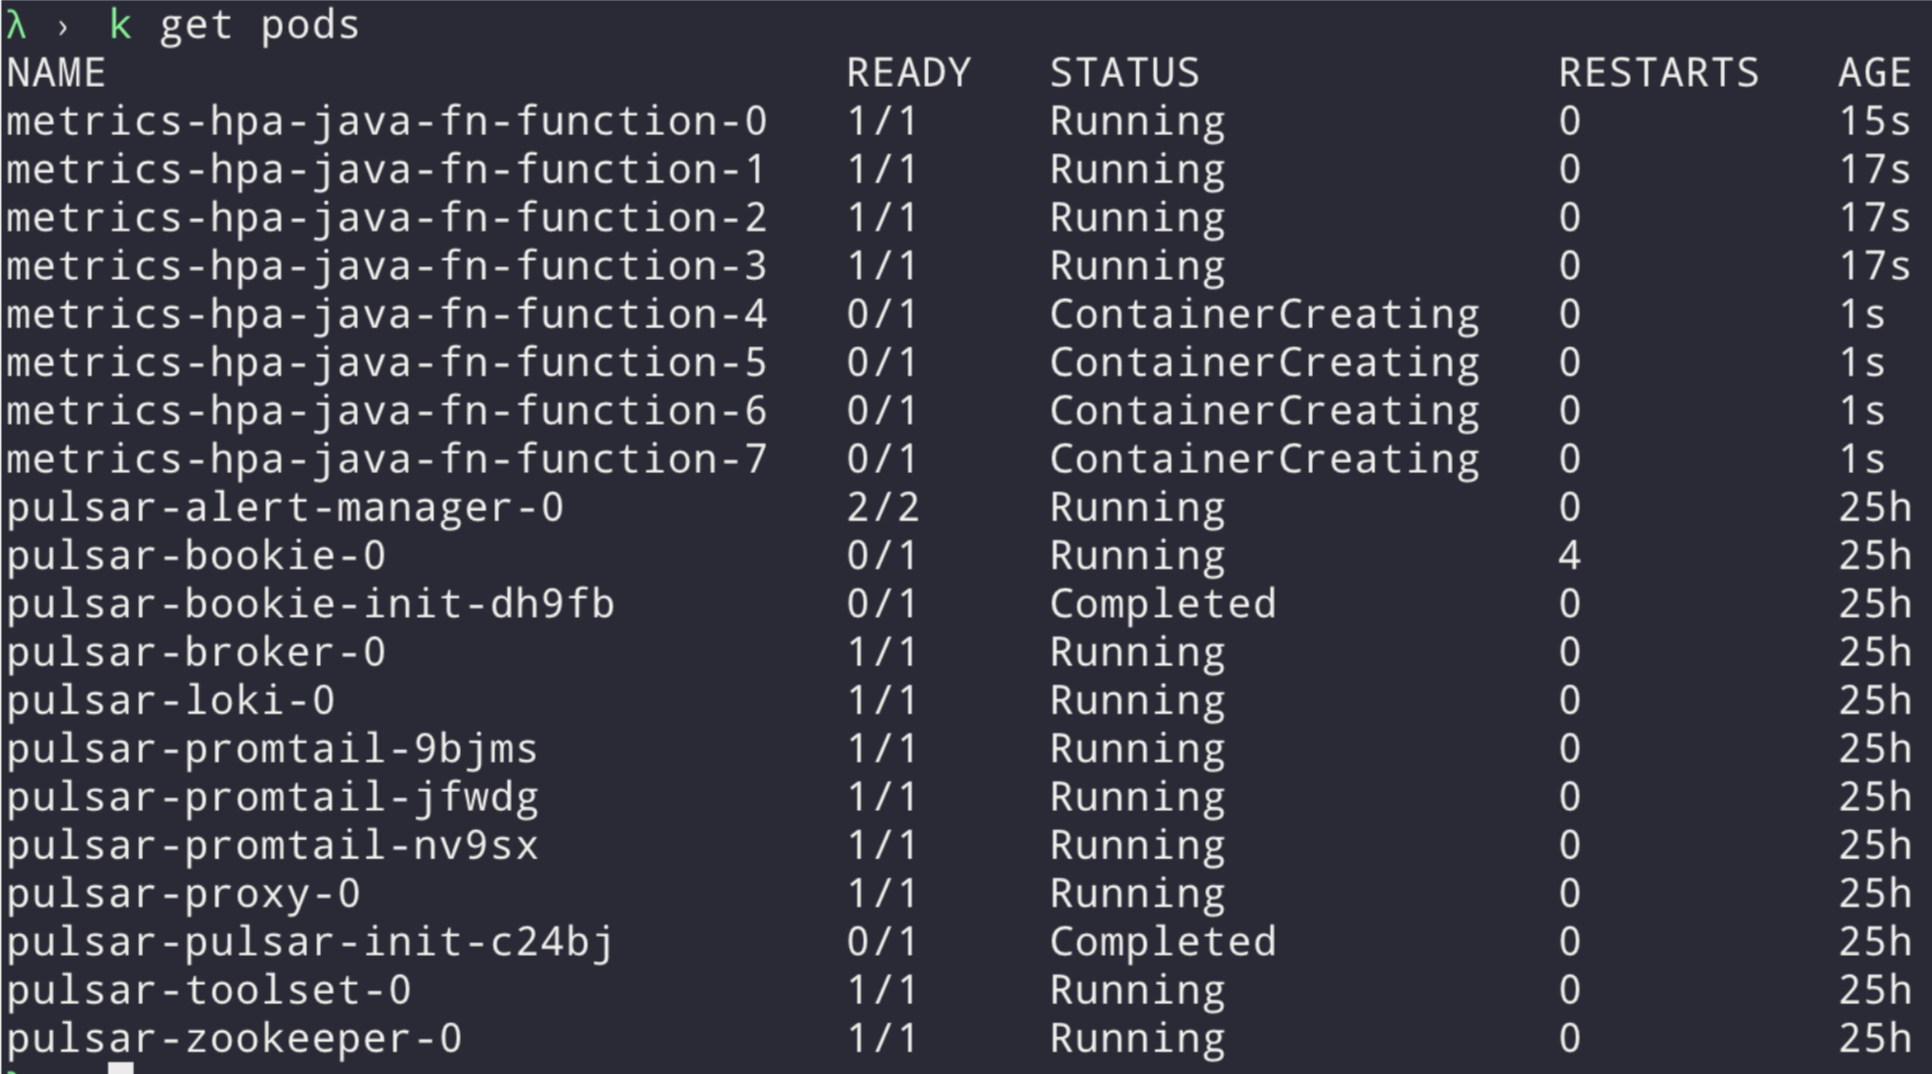
With the messages coming to the input topic, we should see at least 2 or 3 new Pods being created and running to process the backlog messages.
Run kubectl get pods to verify if there are multiple Pods with prefix "metrics-hpa-java-fn” in the name, as shown in Fig.1. To gain insights into the HPA, you can use kubectl describe hpa to get a more detailed output showing why replicas have been added or removed.
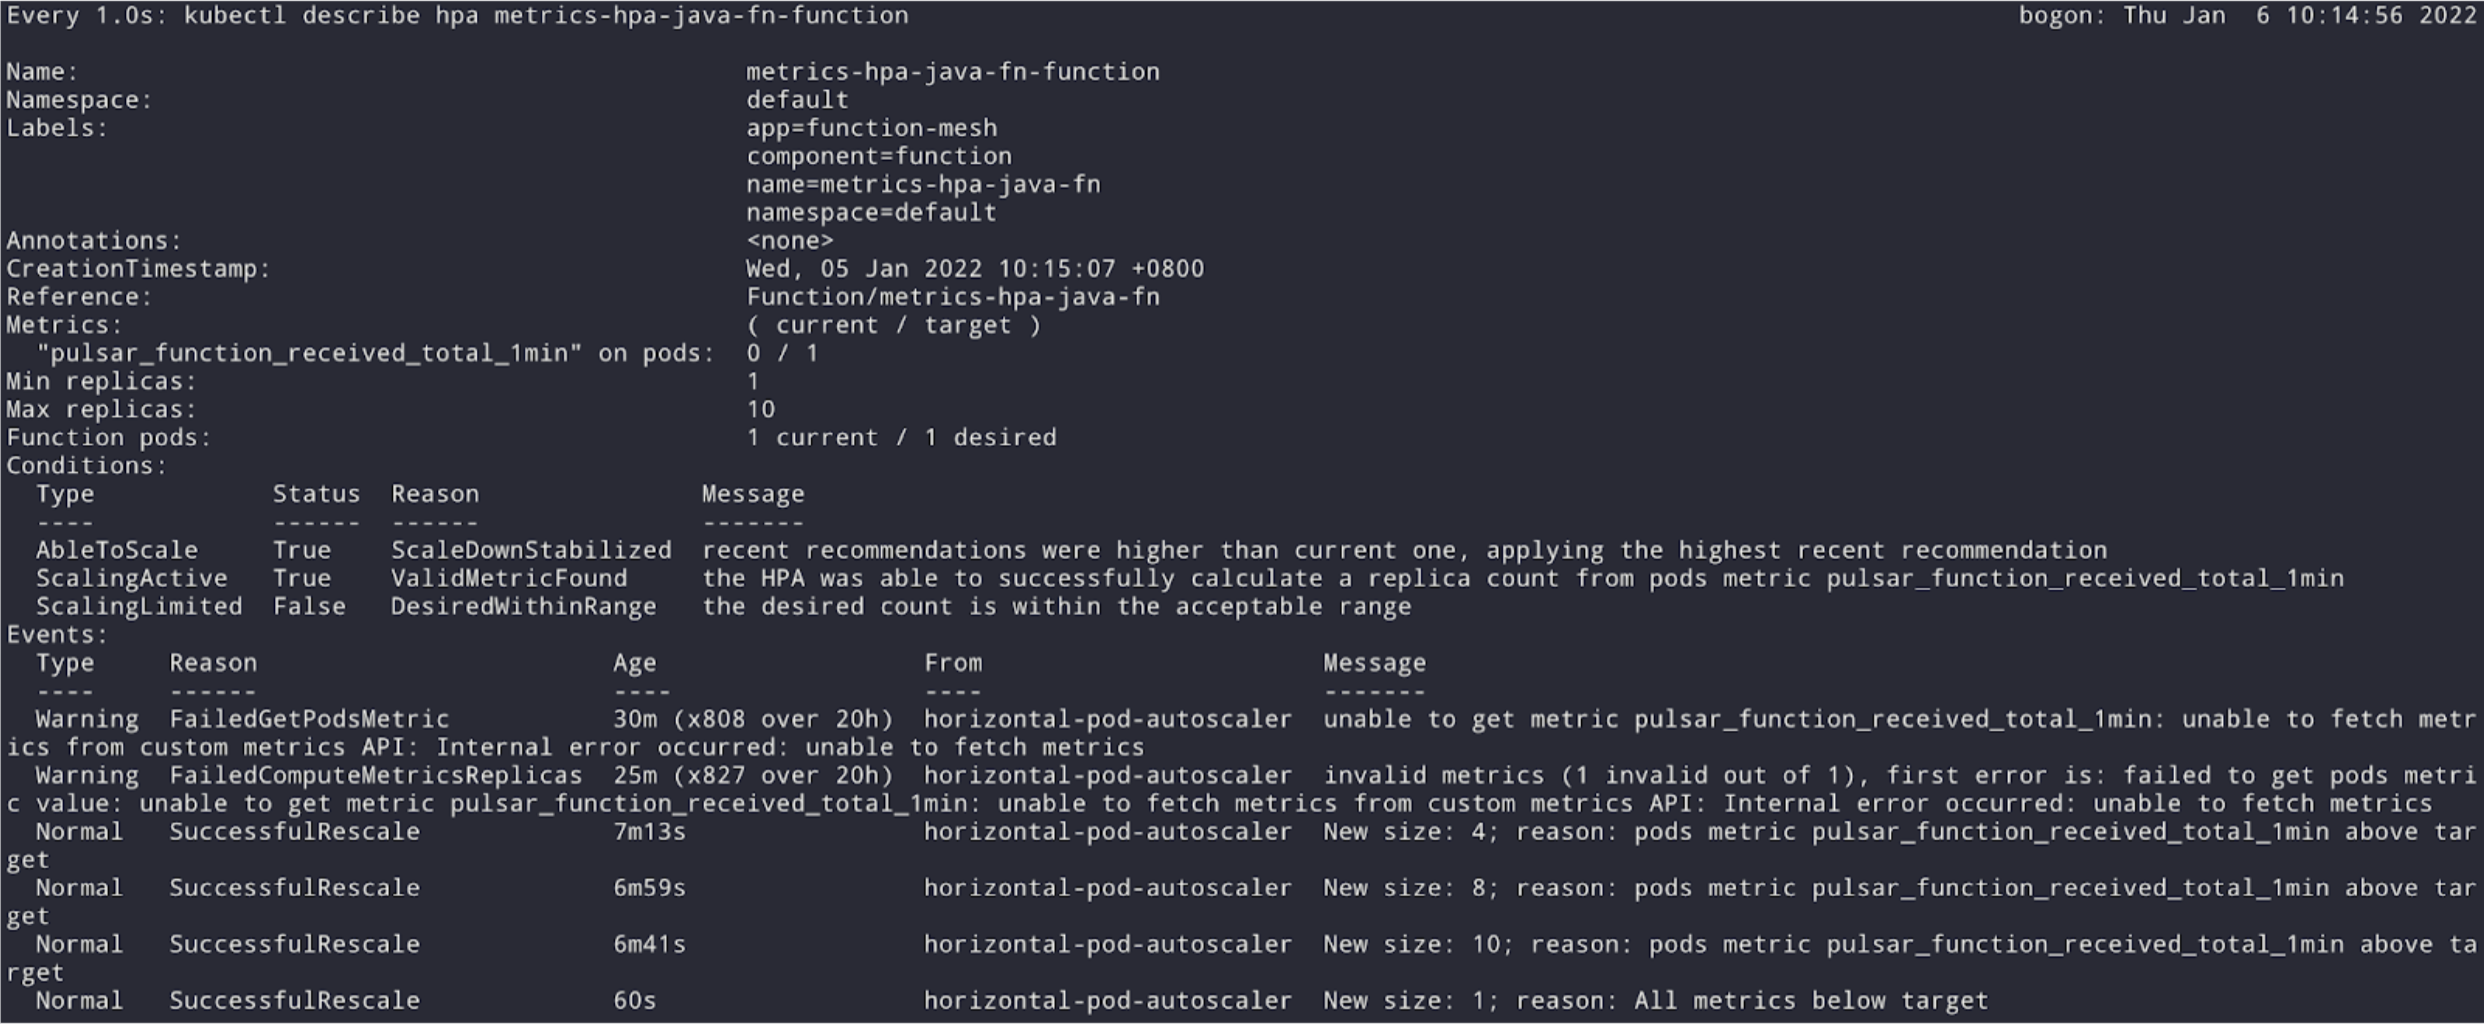
You can get the HPA name with kubectl get hpa and assuming the created name is “metrics-hpa-java-fn-hpa”, you can then observe the HPA with the following watch command, as shown in Fig. 2. watch -n 1 "kubectl describe hpa metrics-hpa-java-fn-hpa"
Future Work : Auto-Scale to / from Zero
We’d like to bring a scale-to-zero feature to Function Mesh soon. With this feature enabled, if a function’s input topic has no backlog, Function Mesh would scale the function down to zero replicas to reduce the cost. However, the current Kubernetes stable release (v1.19) does not support scale-to-zero in HPA by default. You can only use scale-to-zero as an alpha feature after enabling Kubernetes Feature Gates HPAScaleToZero. The Kubernetes community is actively working on a stable version of scale-to-zero (see issue #2021 and PR #2022) and we would like to see this enhancement soon.
Meanwhile, we will be exploring how to bring scale-to-zero to Function Mesh , possibly with the help of third-party tools, such as KEDA, and by implementing an idler, like the service-idler from openshift. We will also try to minimize the extra resources required to enable the feature.
References
- Docs Function Mesh
- Blog Introducing Function Mesh - Simplify Complex Streaming Jobs in Cloud
- Docs Kubernetes - Horizontal Pod Autoscaling
- Docs Kubernetes - Metrics API
- Docs Prometheus Operator
- Docs Prometheus Adapter end-to-end walkthrough
- Docs Prometheus Adapter configuration walkthrough