Introduction
Pulsar 3.0 was released on May 2 and introduces a variety of new feature enhancements that improve the performance and stability for teams operating Pulsar at scale as well as making it more stable (and predictable) for powering messaging and data streaming services for mission critical use cases. Among these improvements is transaction buffer segmented snapshots. The new design incorporates multiple snapshot segments through a secondary index, with index and snapshot segments stored in different compact topics.
The transaction buffer plays an important role in Pulsar transactions, serving as a repository for messages produced within a transaction. In Pulsar releases prior to 3.0, the transaction buffer involves handling messages sent with transactions and taking periodic snapshots to avoid replaying all messages from the original topic. However, when a topic has long-term data retention and many aborted transactions, a single snapshot may become a bottleneck, causing increased costs as the snapshot size grows.
To evaluate the effectiveness of using multiple snapshot segments, the engineering team at StreamNative, who contributed to the release of Pulsar 3.0, performed some benchmark tests using the OpenMessaging Benchmark framework. This benchmark report juxtaposes the new transaction buffer strategy of using multiple snapshots (segmented snapshots) against the previous single snapshot approach, focusing on key performance indicators such as throughput and latency.
The objective of this report is to offer users insights to select the most suitable strategy for their specific use cases, and to inform decisions regarding future optimizations and enhancements for more efficient transaction buffer management.
Key benchmark findings
7.5x improvement for network IO efficiency
When tested under the same transaction abort rates, the newly implemented multi-snapshot strategy consistently maintained a steady throughput, averaging at 2 MB/s, and displayed a regular, periodic oscillation. This is in stark contrast to the previous strategy, which demonstrated an increasing throughput with an average rate of 15 MB/s. The new strategy, therefore, offers a significant advantage in terms of network IO conservation.
20x lower write latency
The multi-snapshot strategy consistently kept write latency within a narrow band of 10-20ms. This is a marked improvement over the previous strategy, which saw write latency continually growing up to 200ms, an indication of a performance bottleneck.
20x shorter Garbage Collection (GC) pauses
Throughout the testing period, the GC pauses for the new multi-snapshot strategy consistently hovered around 100ms, demonstrating efficient memory management. By comparison, the previous strategy saw GC pauses that not only increased over time but reached up to 2 seconds and even exceeded 20 seconds after an hour of testing. The consistent and stable performance of the new strategy points to enhanced system stability and operational efficiency.
Test overview
What we tested
We chose the following five performance indicators for benchmark testing, as they provide a comprehensive evaluation of system performance and help us better understand how the system behaves under different pressures.
1. Throughput
This metric measures the amount of data that a system can handle within a specific timeframe. It is a crucial indicator of a system’s processing power and network efficiency. We anticipated that the new implementation would utilize network IO more efficiently than the existing one (i.e., higher throughput for the single snapshot strategy).
2. Entry size and write latency
Entry size refers to the size of data segments written into the system, while write latency measures the delay between the issue of a write request and the completion of the operation. Smaller entry sizes and lower write latency generally improve system responsiveness and performance. The new implementation was expected to limit the size of snapshot segments, which might reduce write latency compared to the previous one. We expected a reduction in both the entry size and write latency.
3. CPU usage
This metric quantifies the intensity of Central Processing Unit (CPU) utilization by the system. It’s a critical metric as both the new and old strategies can potentially impact CPU usage. Under the correct configurations, we anticipated that the CPU usage of the new strategy would not exceed that of the old one and would be more stable.
4. GC pauses
Garbage Collection (GC) is an automatic memory management method to free up memory no longer in use or needed. GC pauses occur when GC operations pause the program to perform memory clean-up, which could negatively impact system performance. By monitoring these pauses, we can understand how the system manages memory and maintains performance. We expected a decrease in GC pauses with the new implementation.
5. Heap memory
Heap memory refers to the runtime data area from which memory for all class instances and arrays is allocated. High heap usage could signal memory leaks, inadequate sizing, or code that creates excessive temporary objects. Therefore, tracking heap memory usage is crucial to ensuring effective use of memory resources. We expected a decrease in heap memory usage.
In summary, we hoped that these tests could demonstrate the superior performance of the new strategy, including lower throughput, reduced write latency, optimized CPU usage, fewer GC pauses, and lower heap memory usage.
How we set up the tests
We conducted all tests using the OpenMessaging Benchmark framework with the hosted service on StreamNative Cloud. The test environments for both snapshot strategies were identical in terms of infrastructure configurations and benchmark settings. In each case, we used a hosted Pulsar cluster deployed on Kubernetes, comprising 3 broker Pods, 3 bookie Pods, and 3 ZooKeeper Pods. We used Grafana to provide observability for the necessary metrics.
Given that snapshots are used to store information of aborted transactions, which will be cleared when the original transactional message ledger is deleted, we tested snapshot strategies under conditions of high transaction abort frequency and long retention time.
See the following configurations for the benchmark testbed details.
Infrastructure
- StreamNative Cloud: Hosted service
- ~Infrastructure vendor: Google Cloud
- ~Settings: Advanced with Transactions enabled
- Image: streamnative/pulsar-cloud:3.0.0.3-SNAPSHOT
- Kubernetes version: 1.24.11-gke.1000
- Network speed: 30 Gbps
- Pulsar cluster components:
- ~3 broker Pods, each with:
- ~~CPU request: 4 cores
- ~~Memory request: 4Gi
- ~~Heap size: 2G
- ~~Direct memory size: 2G
- ~3 bookie Pods, each with:
- ~~CPU request: 2 cores
- ~~Memory request: 4Gi
- ~~Heap size: 1G
- ~~Direct memory size: 2G
- ~~1 volume for the journal (default size: 128Gi) and 1 volume for the ledger (default size 1Ti)
- ~3 ZooKeeper Pods, each with:
- ~~CPU request: 500m
- ~~Memory request: 1Gi
- ~~Heap size: 1G
- ~~Direct memory size: 1G
- Observability tool: Grafana
Benchmark settings
consumerPerSubscription: 0
messageSize: 100B
partitionsPerTopic: 3
path: workloads/transaction-3-topic-3-partitions-100b.yaml
payloadFile: payload/payload-100b.data
producerRate: 3000
producersPerTopic: 1
subscriptionsPerTopic: 0
testDurationMinutes: 6000
topics: 3
Transaction buffer snapshot settings
Single snapshot strategy config:
PULSAR_PREFIX_transactionBufferSegmentedSnapshotEnabled: "false"
PULSAR_PREFIX_transactionCoordinatorEnabled: "true"
PULSAR_PREFIX_transactionBufferSnapshotSegmentSize: "51200"
PULSAR_PREFIX_maxMessageSize: "52428800"
PULSAR_PREFIX_maxMessagePublishBufferSizeInMB: "52428800"
PULSAR_PREFIX_numIOThreads: "8"
PULSAR_PREFIX_transactionBufferSnapshotMinTimeInMillis=5000
PULSAR_PREFIX_transactionBufferSnapshotMaxTransactionCount=1000
bookkeeper.PULSAR_PREFIX_nettyMaxFrameSizeBytes: "52531200"
Multi-snapshot strategy config:
PULSAR_PREFIX_transactionBufferSegmentedSnapshotEnabled: "true"
PULSAR_PREFIX_transactionCoordinatorEnabled: "true"
PULSAR_PREFIX_transactionBufferSnapshotSegmentSize: "1024000"
PULSAR_PREFIX_numIOThreads: "8"
PULSAR_PREFIX_transactionBufferSnapshotMinTimeInMillis=5000
PULSAR_PREFIX_transactionBufferSnapshotMaxTransactionCount=1000
Test procedures
- Set up the test environment with the specified hardware, software, and network configurations.
- Configured the Pulsar Benchmark tool with the selected parameter settings.
- Conducted performance tests for each scenario and compared the multi-snapshot strategy with the single snapshot strategy.
- Monitored and recorded metrics such as throughput, write latency, and entry size.
- Analyzed the results and drew conclusions according to the performance of both strategies.
Benchmark tests and results
We ran the following benchmark tests with both transaction buffer snapshot strategies.
The test using the previous strategy ran stably for 70 minutes with the same message send rate, transaction abort rate, and snapshot take rate, followed by an unstable hour (see the CPU usage section below). According to the logs, BookKeeper kept reconnecting during this hour:
io.netty.channel.unix.Errors$NativeIoException: recvAddress(..) failed: Connection reset by peer
The new multi-snapshot solution ran stably for 160 minutes until the maximum heap memory size was reached.
We compared the test results from the following five aspects: throughput, latency, CPU usage, GC pauses, and memory.
Throughput
This benchmark test compared the throughput of both strategies in writing snapshots to the system topic, with the same message send rates and transaction abort rates. We anticipated that the segmented snapshots would have significantly lower throughput, resulting in substantial network IO cost savings.
Single snapshot strategy
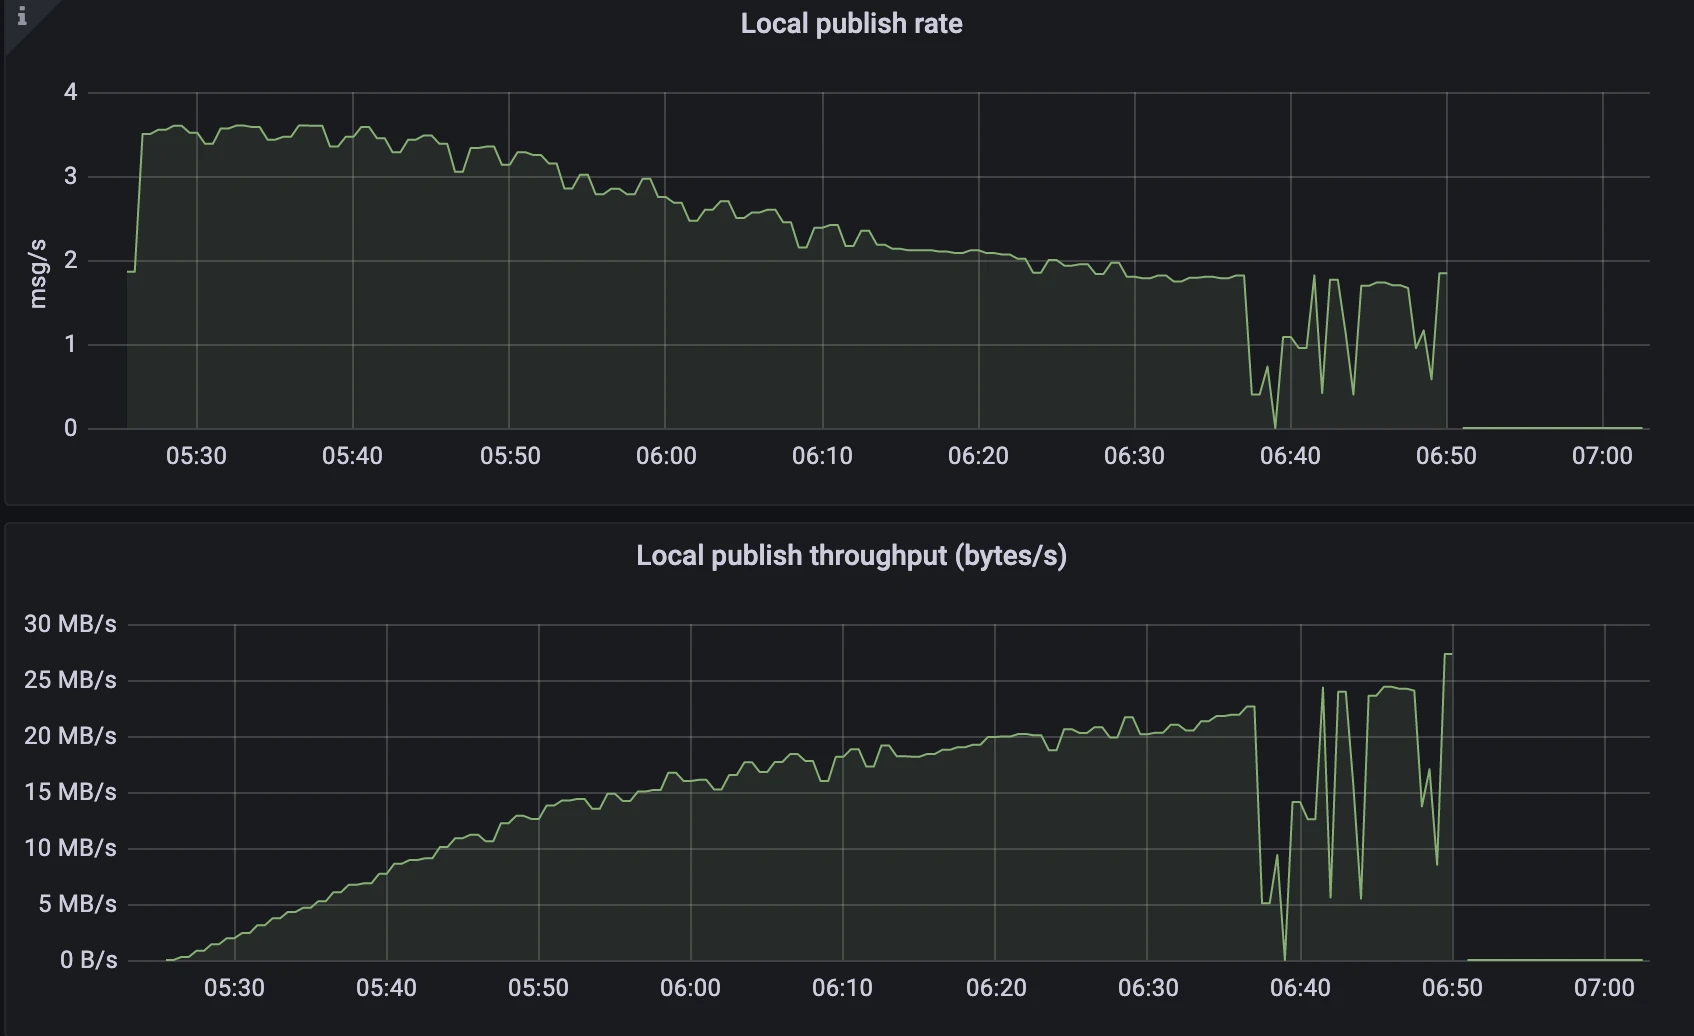 Figure 1. Single snapshot strategy - Publish rate and throughput
- The publish rate gradually declined from 3.5msg/s to 2msg/s.
- The publish throughput increased linearly, reaching up to 25 MB/s.
Multi-snapshot strategy
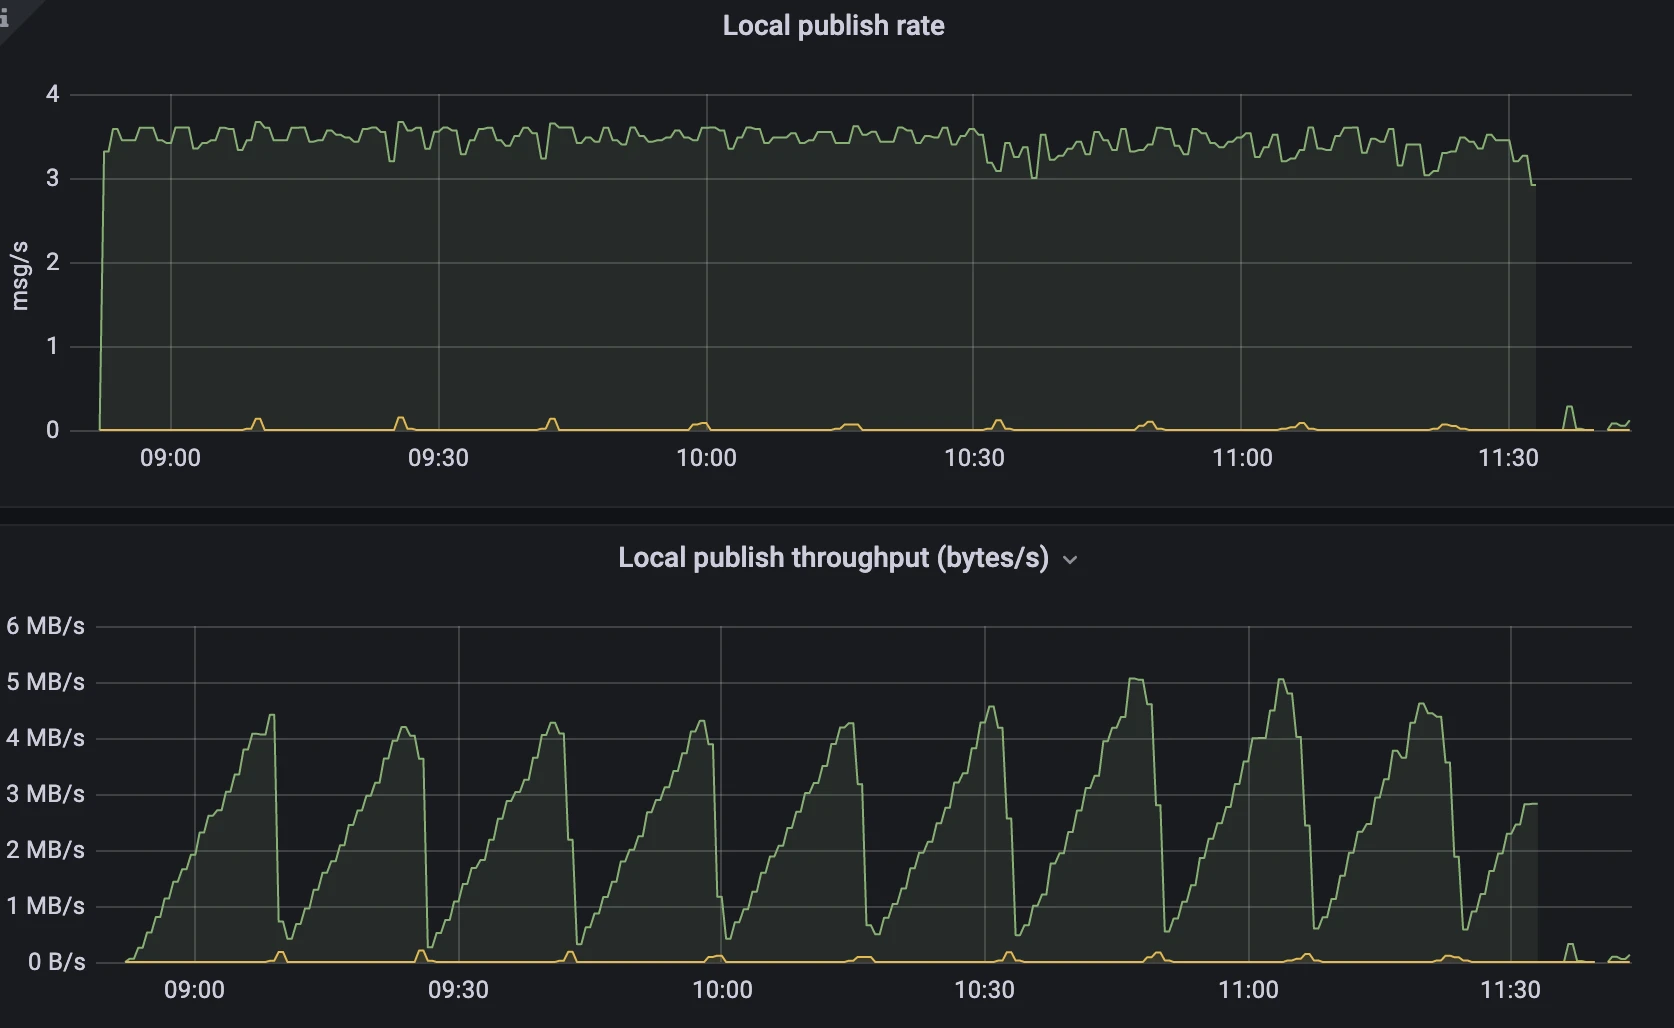 Figure 2. Multi-snapshot strategy - Publish rate and throughput
- The publish rate remained stable at approximately 3.5msg/s.
- The publish throughput saw a periodic change from 0MB/s to 4MB/s.
Analysis
After one hour of testing, the multi-snapshot strategy showed a throughput that was an order of magnitude lower than the single snapshot strategy, and it demonstrated greater stability. The throughput of the single snapshot strategy eventually increased to 25MB/s, but with a decreasing message publish rate. In contrast, the multi-snapshot strategy's throughput periodically fluctuated within the range of 5MB/s, as per the configuration, while maintaining a stable message publish rate. This implies that the new strategy can conserve more network IO resources used for sending messages to the system topic, resulting in improved and more stable performance.
Entry size and write latency
This test focused on snapshot entry size and write latency. We set the snapshot segment size to 1MB (1,024,000 bytes) and did not impose any restrictions on the entry size for single snapshot, to avoid test interruption due to errors caused by excessively large entries. Our expectation was that the new segmented snapshot solution would maintain stability in snapshot segment size, thus ensuring consistently low latency.
Single snapshot strategy
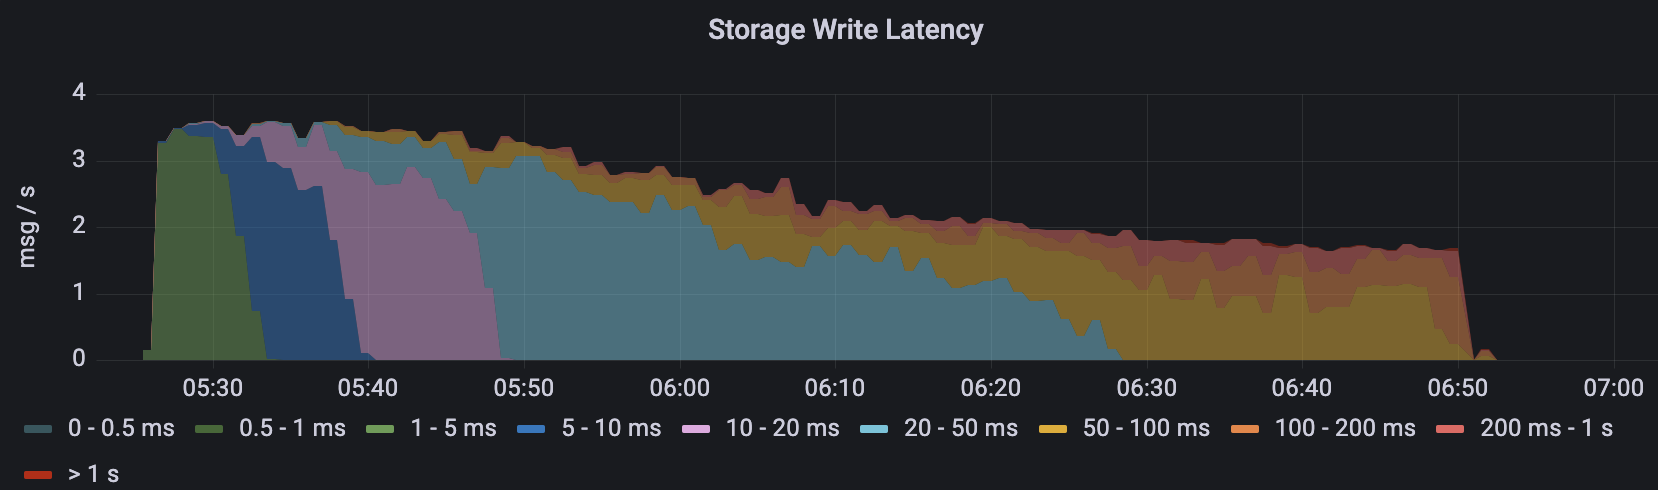 Figure 3. Single snapshot strategy - Write latency
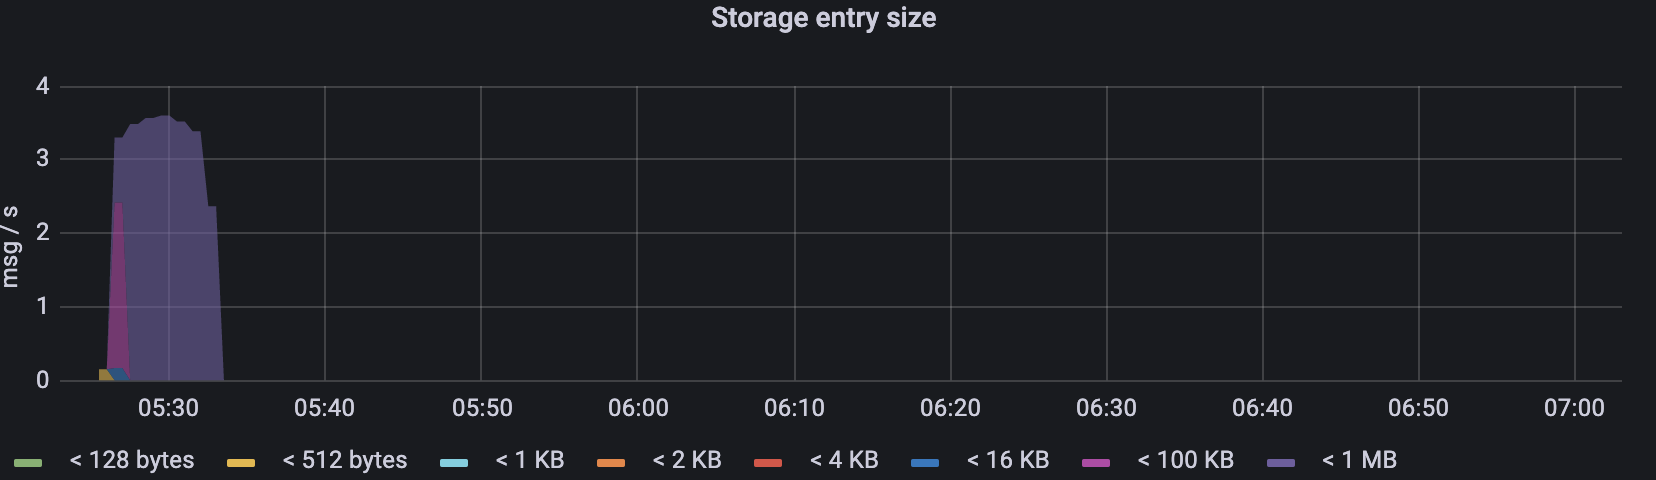 Figure 4. Single snapshot strategy - Entry size
- With the previous single snapshot strategy, the storage writes latency increased over time. After running for an hour, just before the benchmark crashed, the write latency was mostly between 100ms and 200ms.
- The size of the snapshot entry in the previous strategy also increased as the test progressed. After 10 minutes, the size exceeded the observable maximum value of 1MB.
Multi-snapshot strategy
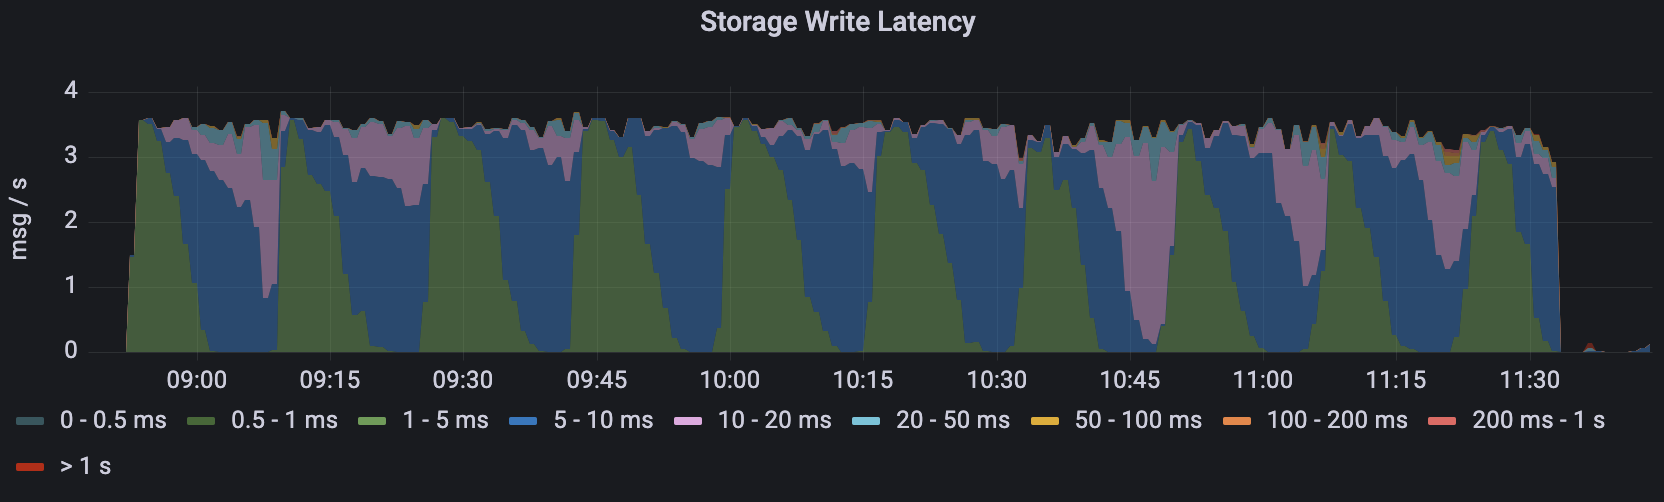 Figure 5. Multi-snapshot strategy - Write latency
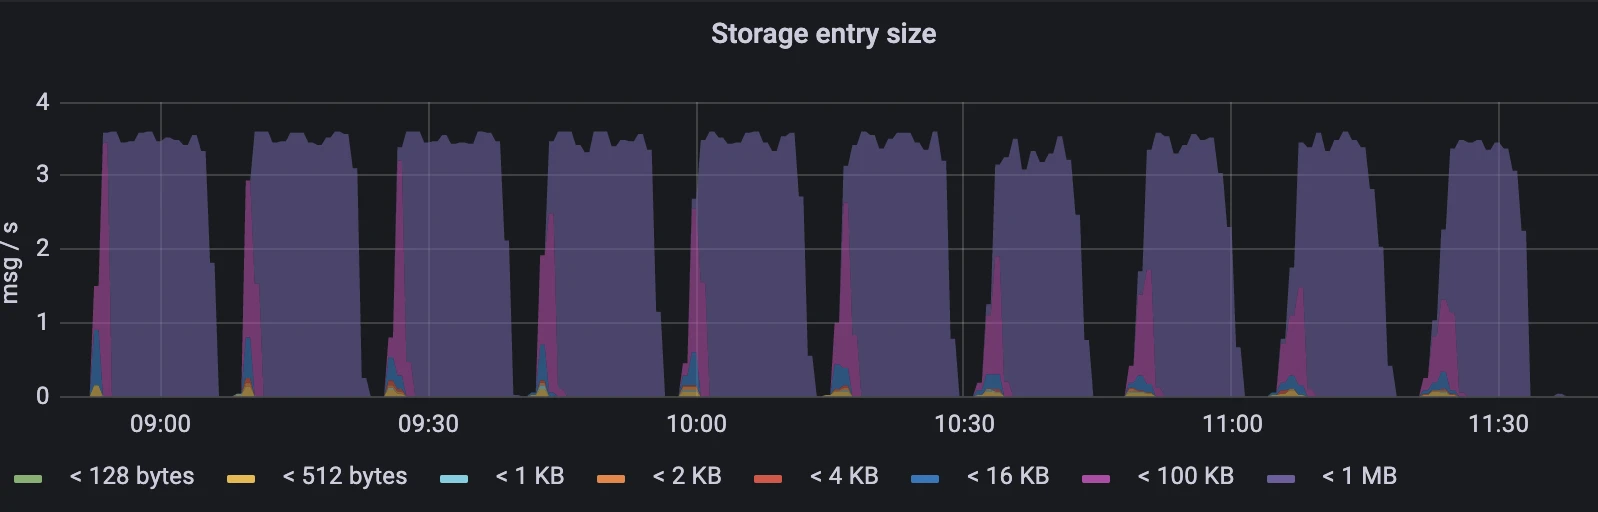 Figure 6. Multi-snapshot strategy - Entry size
- The latency of the new approach showed periodic fluctuations but never exceeded the range of 10-20ms.
- As we set the transactionBufferSnapshotSegmentSize to 1024000, the entry size was always less than 1MB.
Analysis
The test results indicate that the snapshot entry size in the new strategy did not continuously increase like in the single snapshot strategy. It consistently maintained a very low and stable latency. On the other hand, the single snapshot strategy experienced increasing entry size and write latency over time.
CPU usage
This test compared the CPU utilization between the two snapshot strategy. The number of keys during compaction and the size of sent entries both impact CPU utilization. The multi-snapshot strategy stores data in multiple entries, resulting in multiple keys. By contrast, the single snapshot strategy stores all data in a single entry, leading to write amplification. We expected that, under reasonable configurations, such as a snapshot segment size of 1MB, the new strategy would exhibit lower and more stable CPU utilization.
Single snapshot strategy
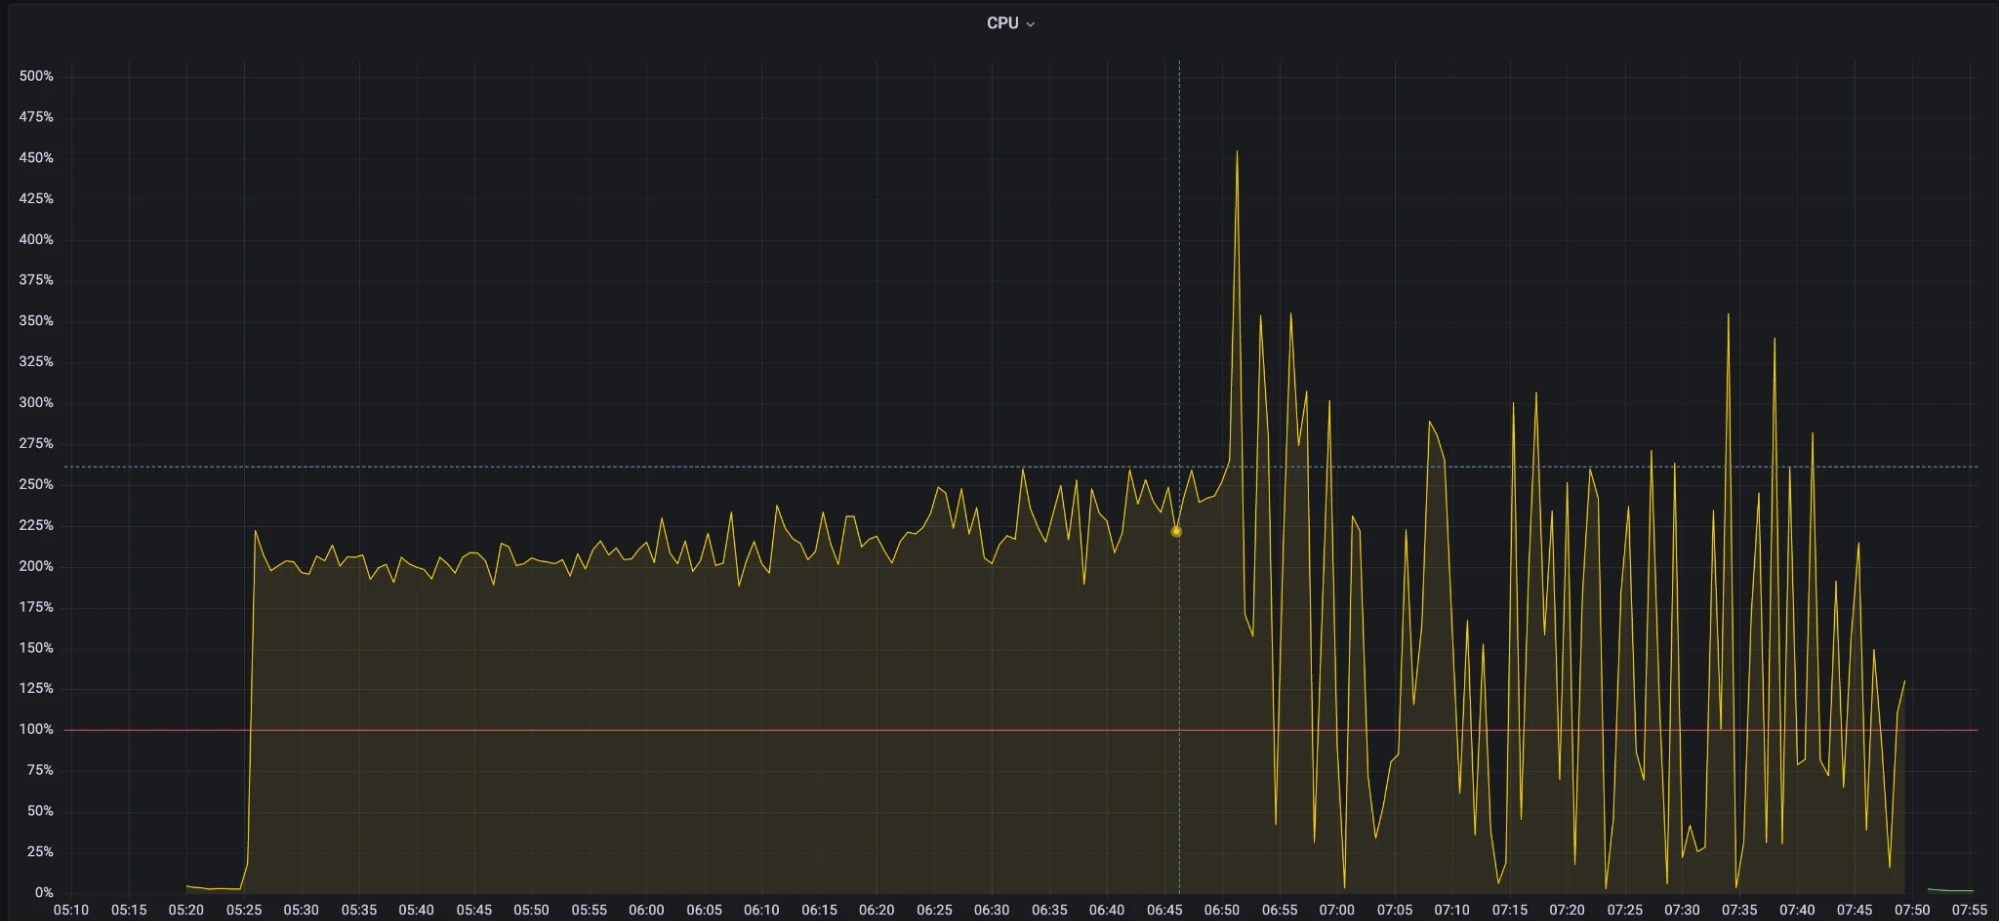 Figure 7. Single snapshot strategy - CPU usage
- During the first 50 minutes of the test, the CPU usage stayed around 200%, with a slight increase.
- After an hour, the CPU usage showed significant fluctuations, and the broker began to become unstable.
Multi-snapshot strategy
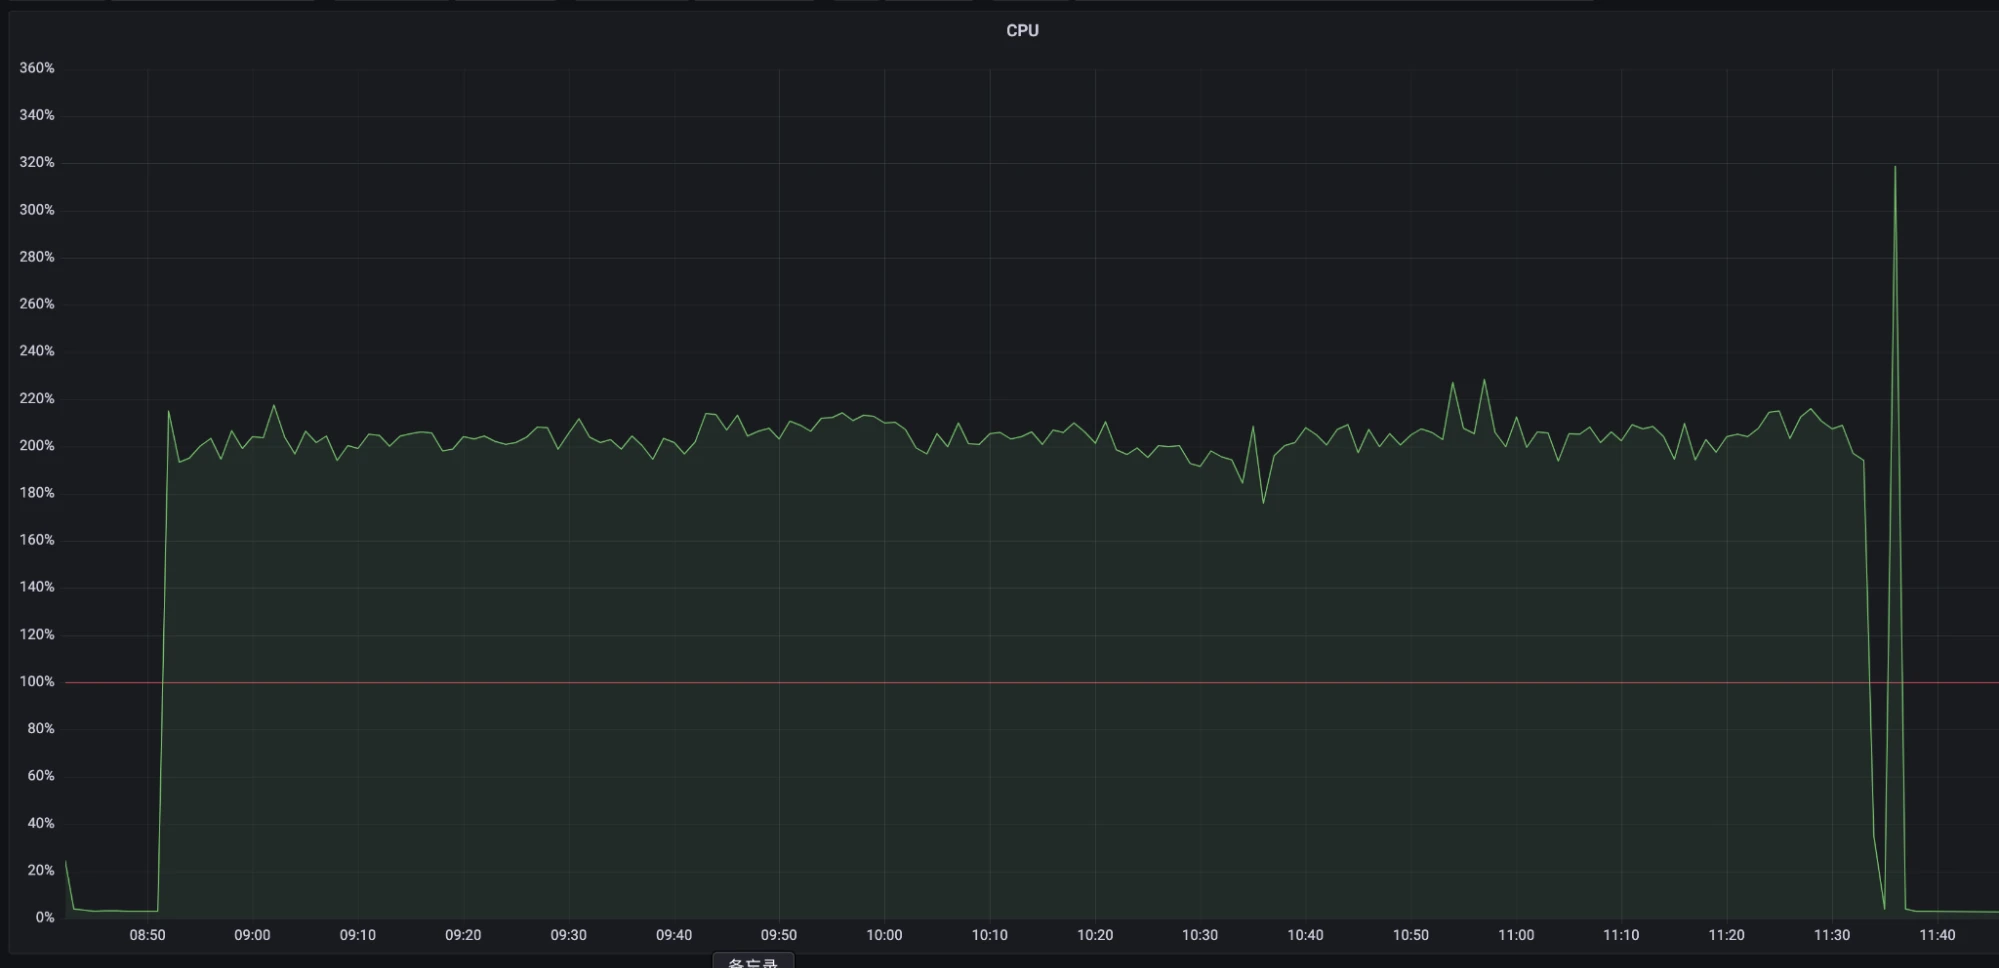 Figure 8. Multi-snapshot strategy - CPU usage
- The CPU usage was stable at about 200% and the test ended due to heap memory OOM.
Analysis
The test results indicate that, under normal circumstances, the CPU utilization of the new strategy was slightly lower than that of the previous strategy, and it remained more stable before reaching machine bottlenecks. This means that the new multi-snapshot strategy outperforms the previous single snapshot strategy in terms of CPU usage.
GC pauses
This test examined the GC pause behavior of both strategies. The size and quantity of temporary objects generated during the snapshot-taking process can impact GC pauses. The test was conducted with a snapshot segment size of 1MB, without any restrictions imposed on the size of messages.
Single snapshot strategy
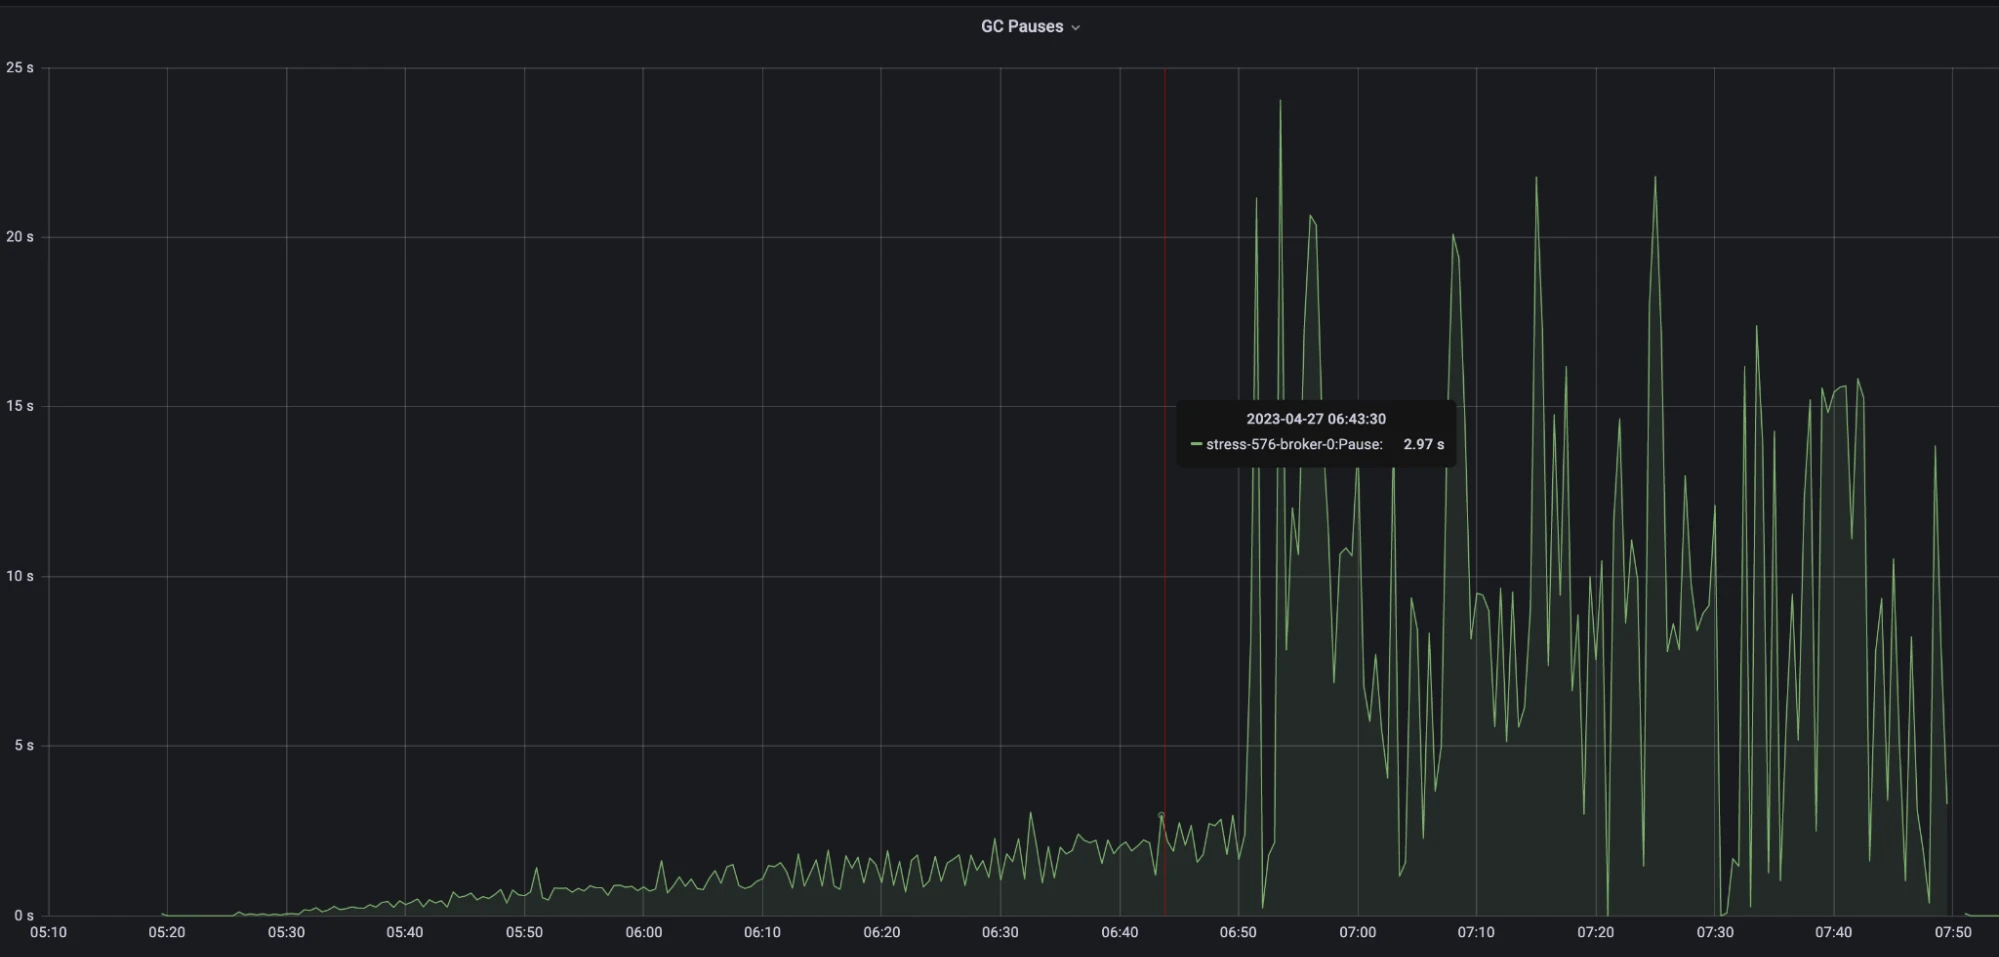 Figure 9. Single snapshot strategy - GC pauses
- During the stable testing period, GC pauses kept increasing, peaking at around 2 seconds.
- After an hour of testing, the test became unstable, and the maximum GC pauses reached approximately 20 seconds.
Multi-snapshot strategy
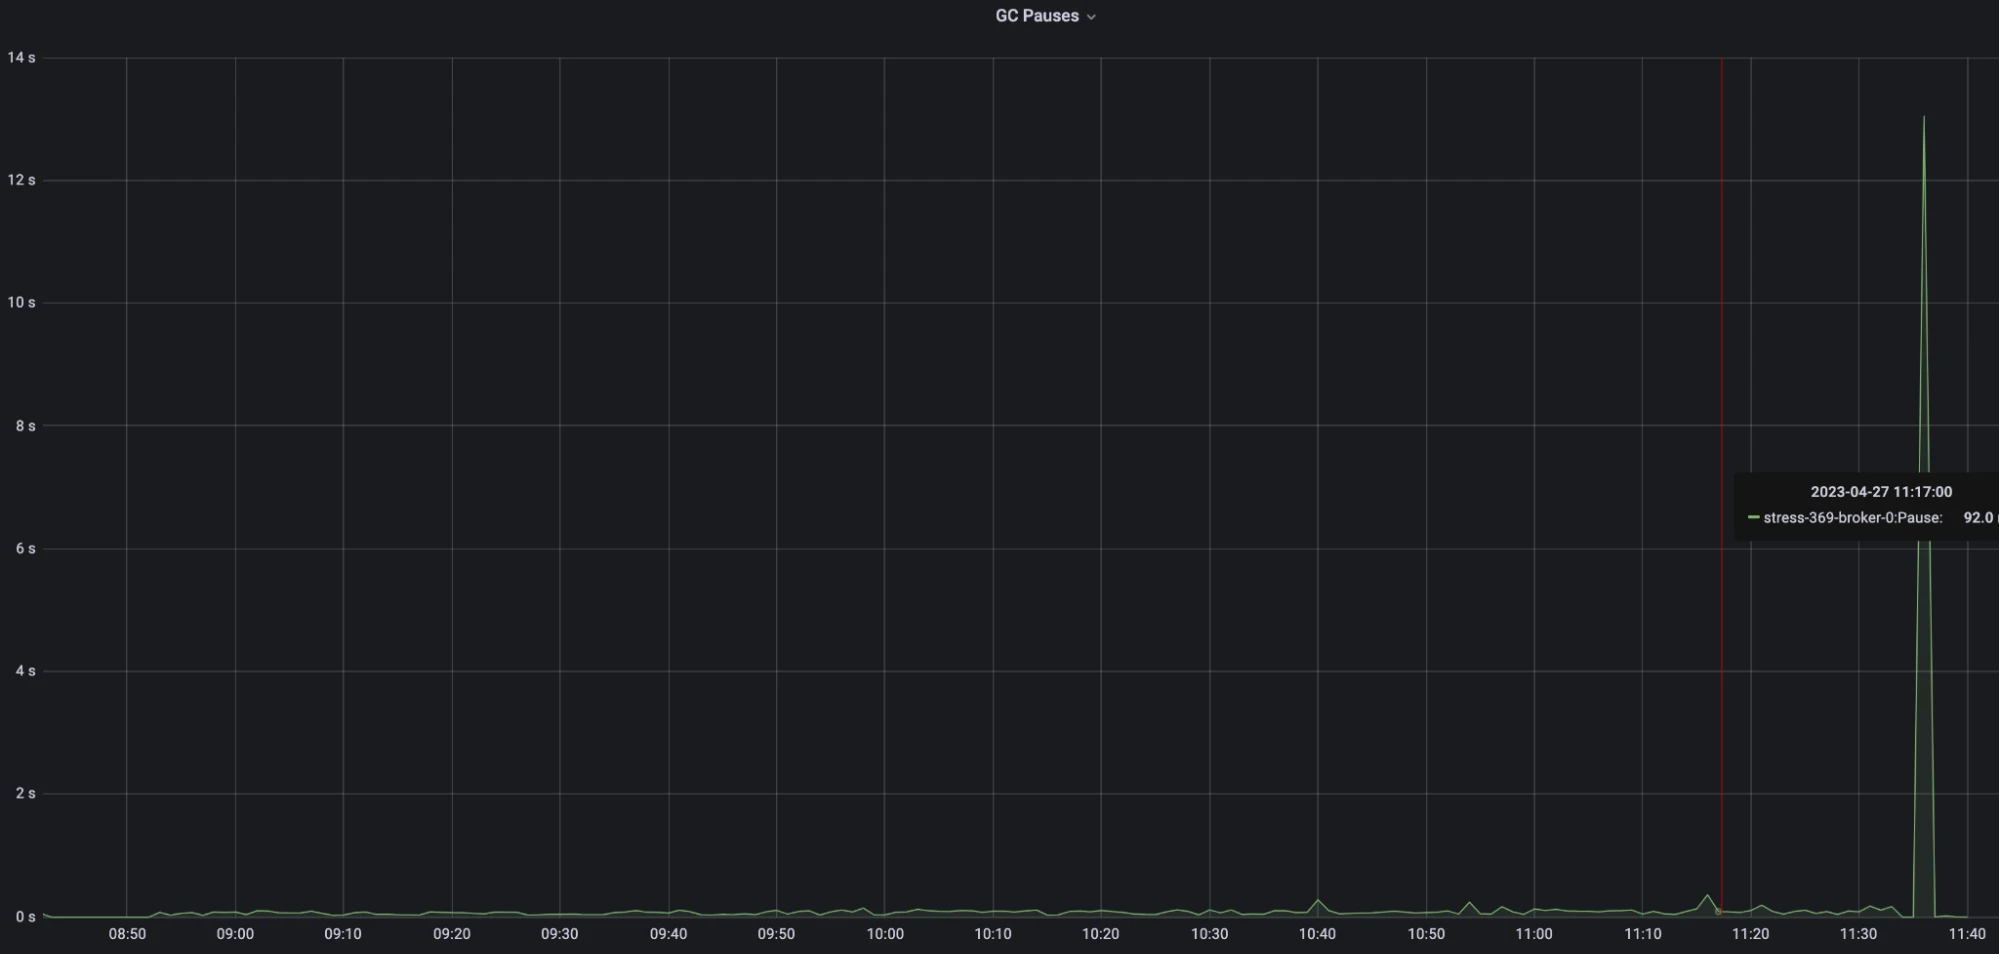 Figure 10. Multi-snapshot strategy - GC pauses
- The delay of the new strategy consistently maintained below 100ms throughput the test.
Analysis
The test results reveal that the GC pause of the new strategy consistently hovered around 100ms, indicating stable performance. In contrast, the GC pause of the previous single snapshot strategy progressively increased. This is probably caused by the write amplification issue, where the size of temporary snapshot objects generated during each operation continually expanded. Furthermore, as the machine approached its performance bottleneck, GC frequency increased significantly, leading to longer GC pauses. This clearly illustrates the superior performance of the new implementation in terms of managing GC pauses.
Heap memory
This test compared the heap memory growth between the two strategies. The size and quantity of temporary objects generated during the snapshot-taking process can impact heap memory consumption. The test was conducted with a snapshot segment size of 1MB, without any restrictions imposed on the size of messages.
Single snapshot strategy
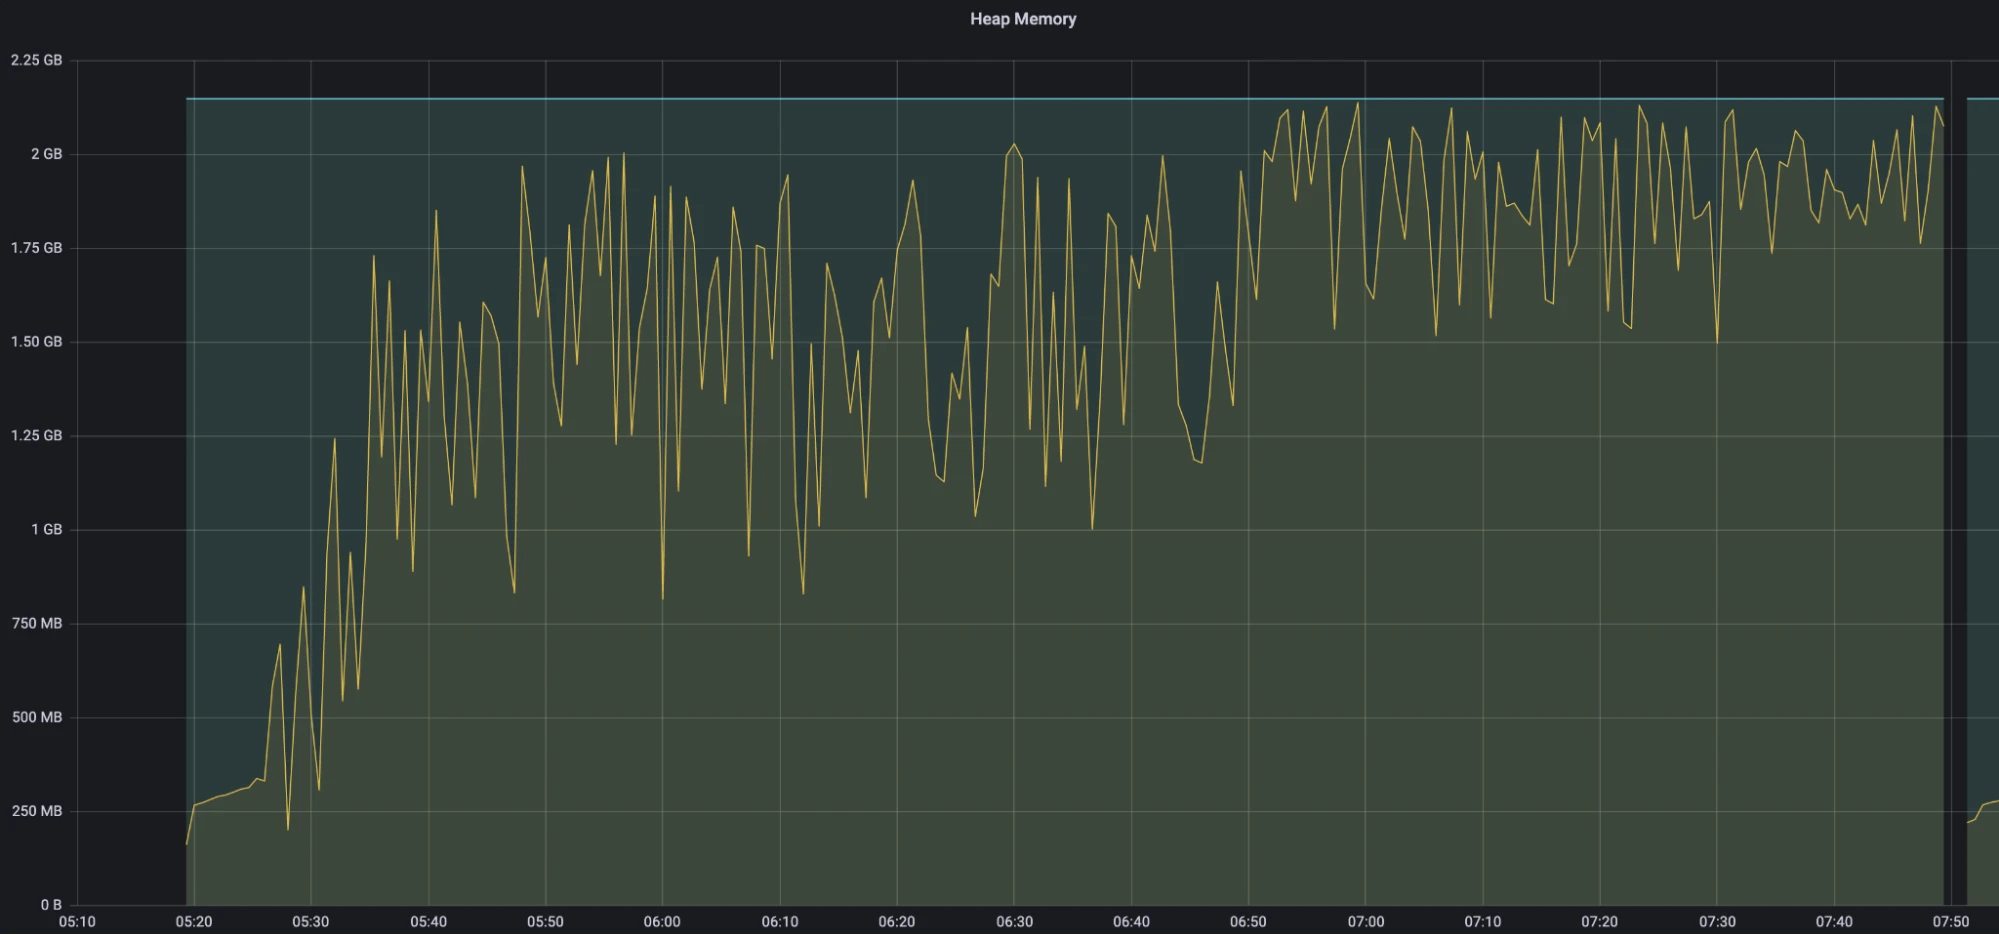 Figure 11. Single snapshot strategy - Heap memory
- After 15 minutes of testing, the heap memory reached 1.5 GB.
- Approximately 6 hours and 50 minutes into the test, the heap memory reached the OOM threshold of 2 GB. It was at this point that the CPU usage and GC pauses began to increase sharply and continued to fluctuate significantly.
Multi-snapshot strategy
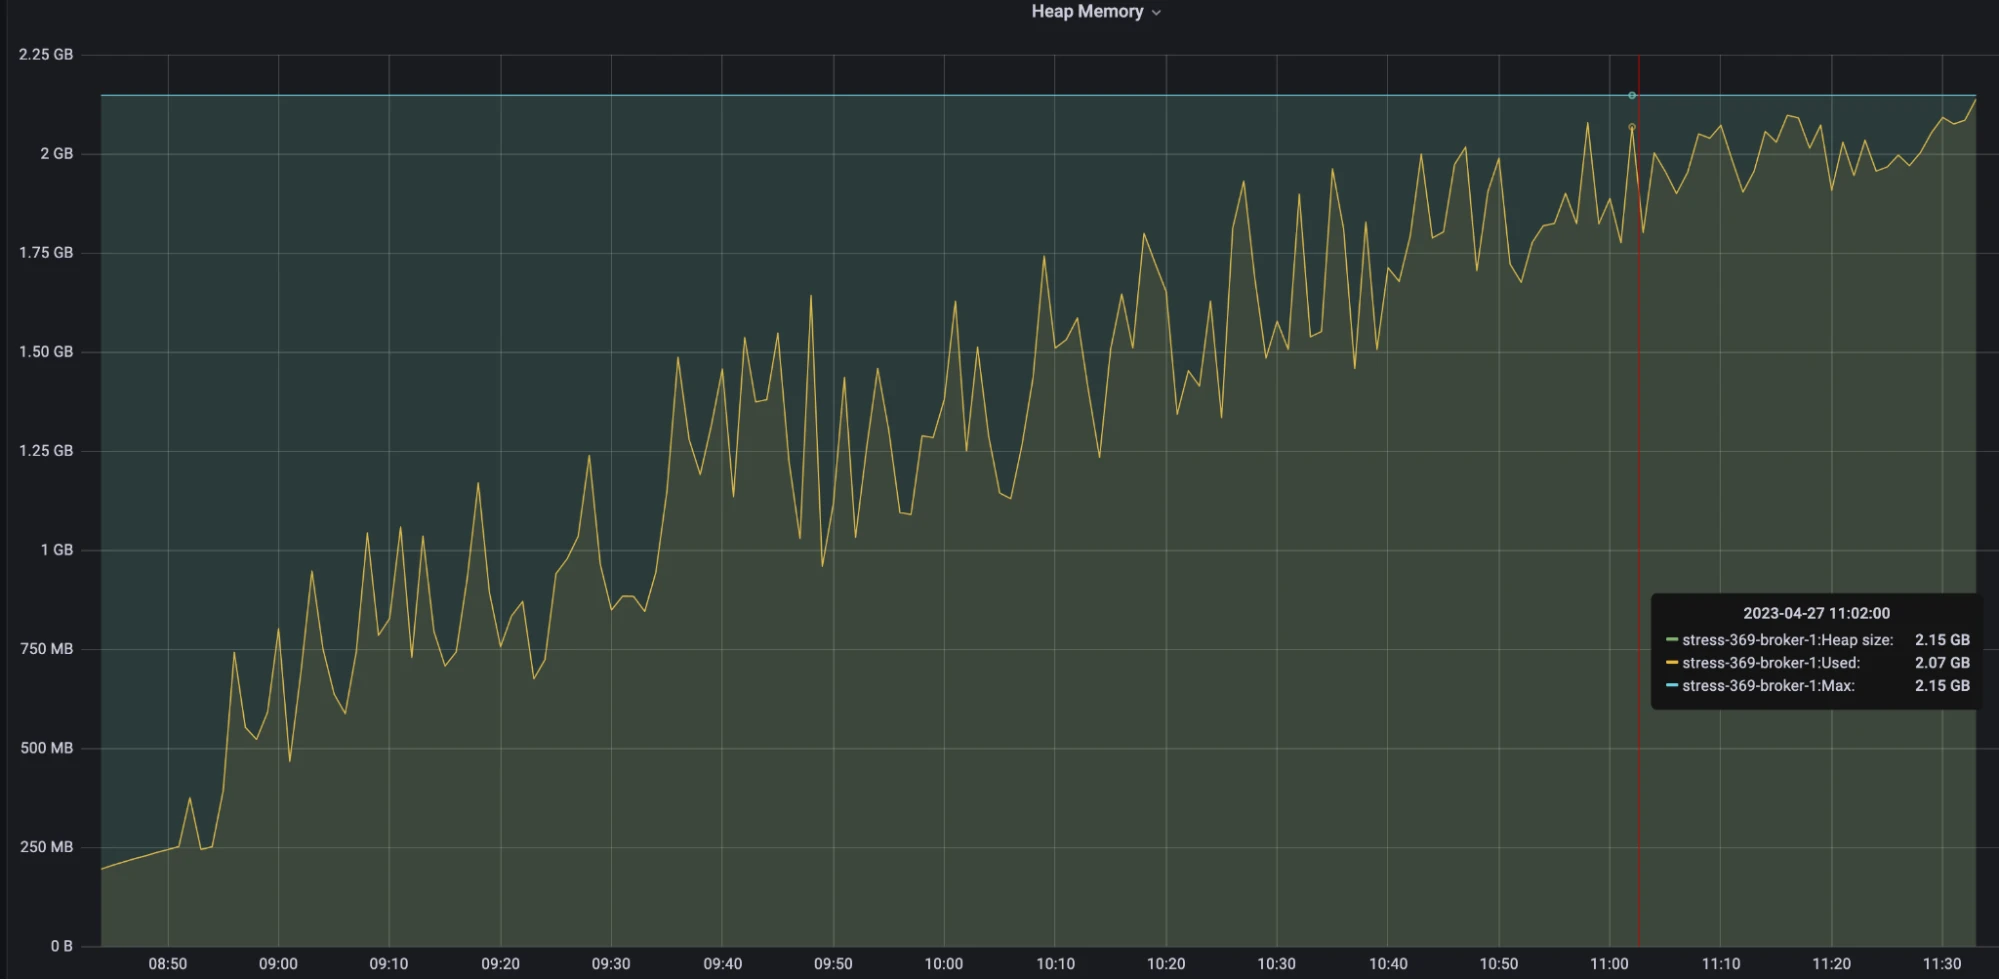 Figure 12. Multi-snapshot strategy - Heap memory
- The memory of the new strategy steadily increased until the end of the test after OOM.
Analysis
The test results show that the new strategy exhibits a slower and more stable heap memory growth pattern. By contrast, the previous strategy experienced a faster and more fluctuating heap memory growth. This implies that the new strategy offers advantages in terms of slower and more controlled memory growth, thus ensuring stability and delaying the onset of performance bottlenecks.
Future improvement: On-demand snapshot segment loading
To reduce startup time when loading transaction buffers, we recommend on-demand snapshot segment loading. The current implementation may read all snapshot segments at startup, leading to longer startup time. With on-demand loading, we can selectively read specific snapshot segments as required, thereby reducing startup time.
Conclusion
Our test results demonstrate that the newly implemented multi-snapshot approach significantly outperforms the previous single snapshot approach in key performance metrics. With the same snapshot frequency, the new solution resolves the write amplification issue, resulting in lower network bandwidth utilization, reduced message latency, shorter GC stop-the-world (STW) times, and a more stable memory growth that avoids frequent garbage collection.
Further optimization, such as the implementation of on-demand loading of snapshot segments and distributed caching, can enhance the performance and stability of the new strategy in transaction buffers.
In real-world applications, we strongly recommend the adoption of the new multi-snapshot strategy.
More resources
Pulsar has become one of the most active Apache projects over the past few years, with a vibrant community driving innovation and improvements to the project. Check out the following resources to learn more about Pulsar.
- Run fully managed Pulsar services and enable transactions with StreamNative Cloud.
- Start your on-demand Pulsar training today with StreamNative Academy.
- Blog A Deep Dive into Transaction Buffer in Apache Pulsar
- Blog A Deep Dive into Transaction Coordinators in Apache Pulsar