Original author: Renyi Wang (Software Engineer, 360 Cloud Platform Messaging Middleware Team). The blog post was originally published at https://mp.weixin.qq.com/s/Qa2uzvO0oiBD9caDi763xw
Apache Pulsar is an excellent distributed messaging system, purpose-built for modern, real-time data needs. Its compute–storage separation architecture offers significant advantages over many other open-source messaging queues, enabling both scalability and operational flexibility. Pulsar also comes with powerful features out of the box, such as delayed message delivery and cross-cluster geo-replication, making it resilient in mission-critical deployments.
What truly sets Pulsar apart, however, is its ability to combine enterprise-grade durability with millisecond latency. In optimized environments, Pulsar can persist messages across replicas in as little as 0.3 milliseconds, while achieving throughput of over 1.5 million messages per second on a single producer thread—all while preserving strict message ordering. This blog post takes a deep dive into how Pulsar achieves these remarkable performance characteristics and what makes its design uniquely capable of delivering both speed and reliability.
Testing environment (context & limits). All latency numbers in this blog post were measured in a low-latency setup: a producer client, two Pulsar brokers, and three bookies deployed in the same data center and connected through a single switch. Storage was backed by NVMe SSDs, and replication was configured as ensemble=2, write quorum=2, ack quorum=2. Under these conditions, one-way broker↔bookie network transit is approximately 50 µs, which is essential to achieving ~0.3 ms end-to-end durable writes. Traversing additional switches, crossing racks/AZs/regions, enabling heavier inline processing (e.g., TLS inspection), or using slower disks will increase observed latencies. A fuller breakdown of hardware and settings appears later in this post.
Pulsar Write Latency Breakdown
A Pulsar producer sending a message incurs latency in two main stages:
- Client to Broker: The time for the client to send the message to the Pulsar broker.
- Broker to Bookies: The time for the broker to persist the message by writing it to multiple bookie storage nodes in parallel (replicas in Apache BookKeeper).
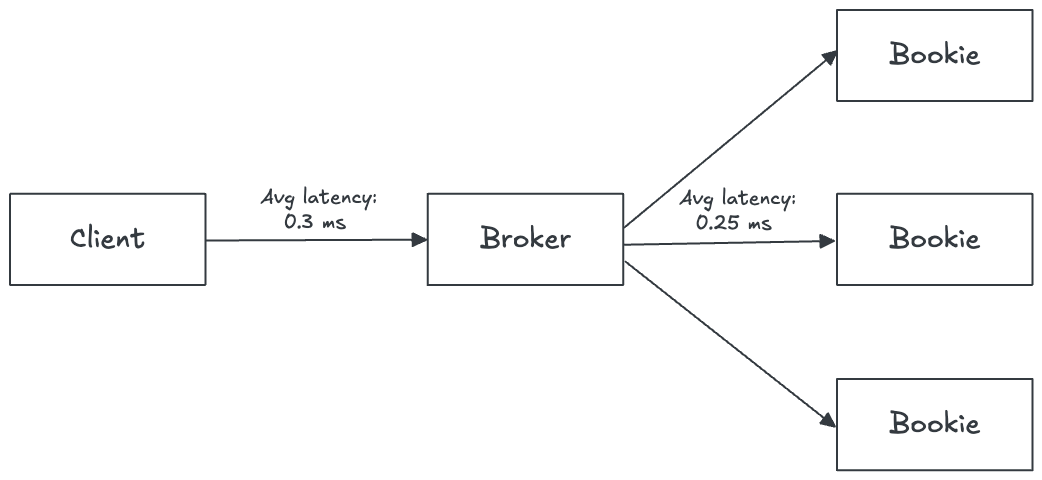
In other words, the end-to-end publish latency includes the network hop from client to broker, plus the broker’s internal processing and the storage write to BookKeeper (which itself replicates to multiple bookies). We will analyze each part in detail in the next sections.
Broker-Side Latency Analysis
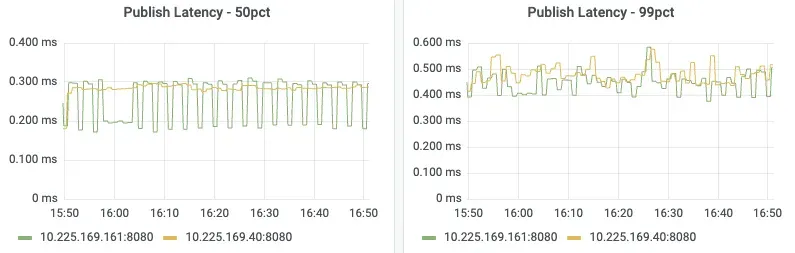
First, we will look into the broker latency. Pulsar provides a metric pulsar_broker_publish_latency (illustrated in Figure 2.) which provides insight into the total time a message spends on the broker side, encompassing the period from its initial receipt to its successful write to BookKeeper and the subsequent client callback completion.
To understand where the broker spends time handling incoming writes, we used Alibaba Arthas to capture a thread-level flame graph. The flame graph revealed that most of the broker latency is spent in a few network I/O operations (sending data to bookies and waiting for responses). Figure 3 illustrates the broker-side flame graph, showing how the workload is distributed across threads.
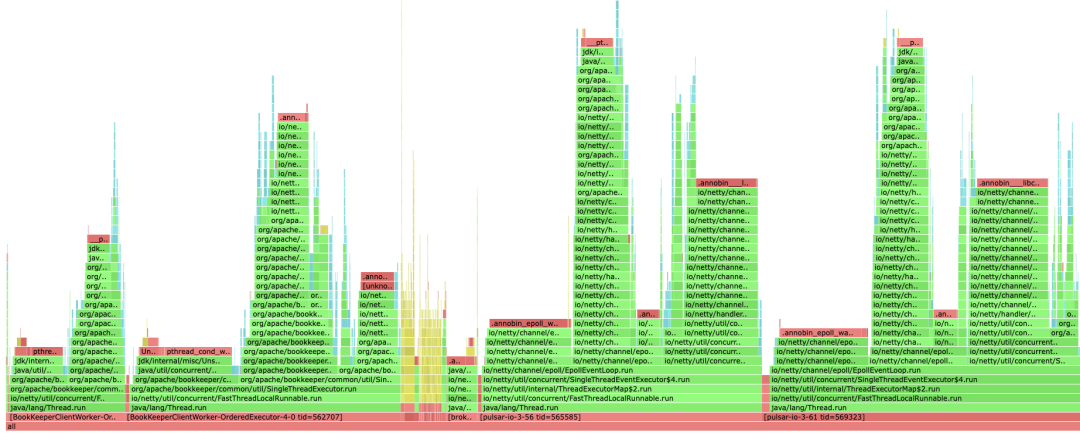
From this flame graph, we identified four main threads on the broker that contribute to publish latency. The breakdown of their time is as follows:
- BookKeeperClientWorker-1 – accounts for roughly 10% of the end-to-end latency. Within this thread, about half of the time is spent dequeuing write requests, and the other half executing the bookie callback and enqueuing the next task.
- BookKeeperClientWorker-2 – about 25% of latency. Approximately 40% of its time is spent taking entries from the bookie queue, 40% sending the write requests to bookies over the network, and ~20% running the broker-side callback when a bookie write succeeds.
- pulsar-io-1 – about 25% of latency. It spends ~30% of the time executing tasks to write to the bookie’s network queue, ~30% reading the bookie’s network response and putting data into a queue, and ~30% waiting (idle or blocking on I/O).
- pulsar-io-2 – about 30% of latency. Roughly 40% is spent reading the client’s incoming write request and adding it to the bookie request queue, 40% on sending the ACK response back to the client, and ~20% waiting (idle).
These four threads—BookKeeperClientWorker and pulsar-io—collaborate to manage data flow and client responses. Specifically, BookKeeperClientWorker threads are responsible for sending data to BookKeeper, ensuring durable storage. Concurrently, pulsar-io threads handle responding to the client, confirming data receipt and processing. This distributed handling means that on the broker, there isn't a single, dominant bottleneck; instead, latency is diffused across various networking and callback processing stages, leading to a more robust and efficient write path.
Bookie-Side Latency Analysis
After understanding publish latency at the broker side, we know that a significant amount of time is spent writing data to bookies. Let's now examine bookie write latency. Once the broker forwards a message to BookKeeper, the BookKeeper bookies (storage nodes) take over. Pulsar’s storage layer is backed by BookKeeper, so understanding BookKeeper’s write path is crucial for optimizing latency. Below, we examine Pulsar’s data storage model, the internals of a bookie’s write operation, and how we tuned it for maximum performance.
Data Storage Model in Pulsar/BookKeeper
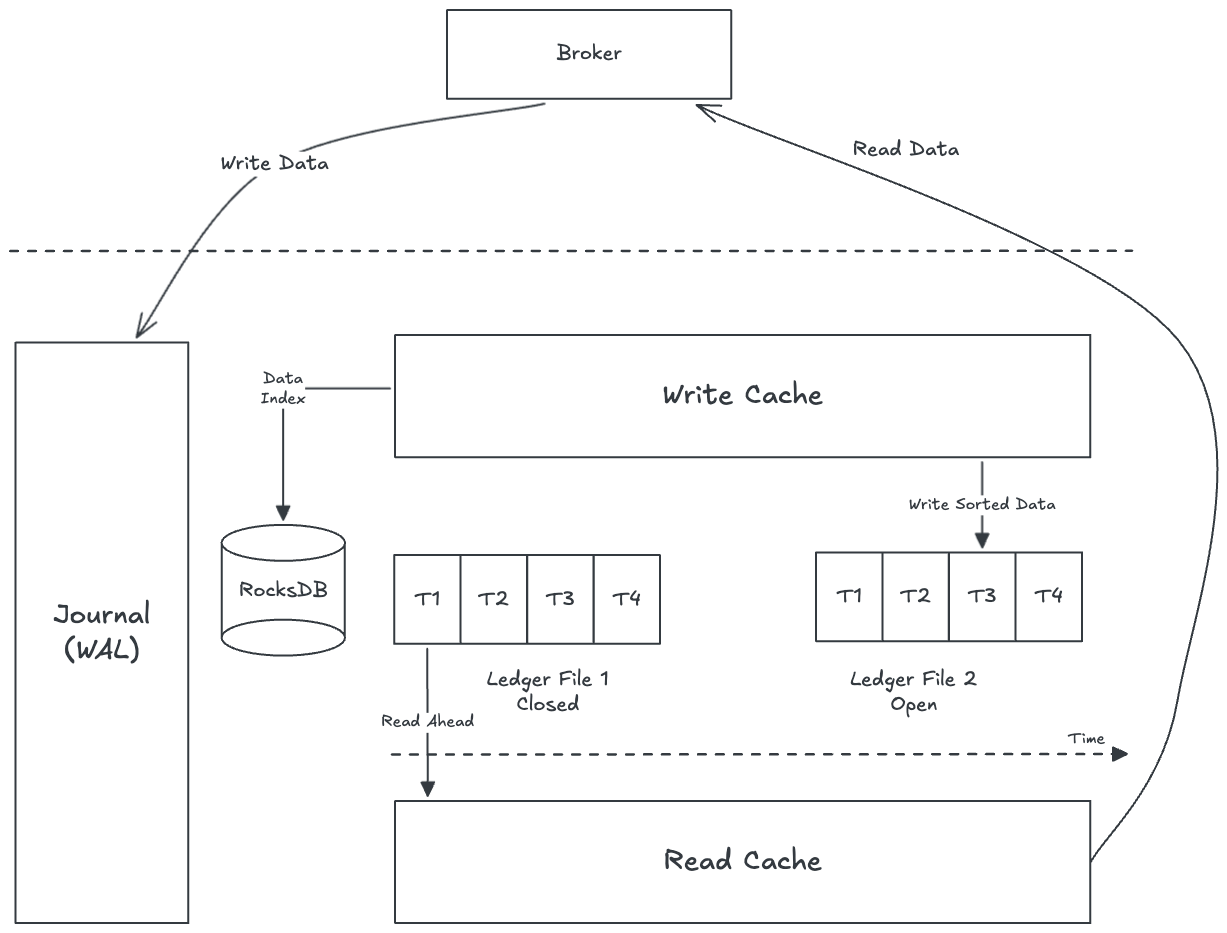
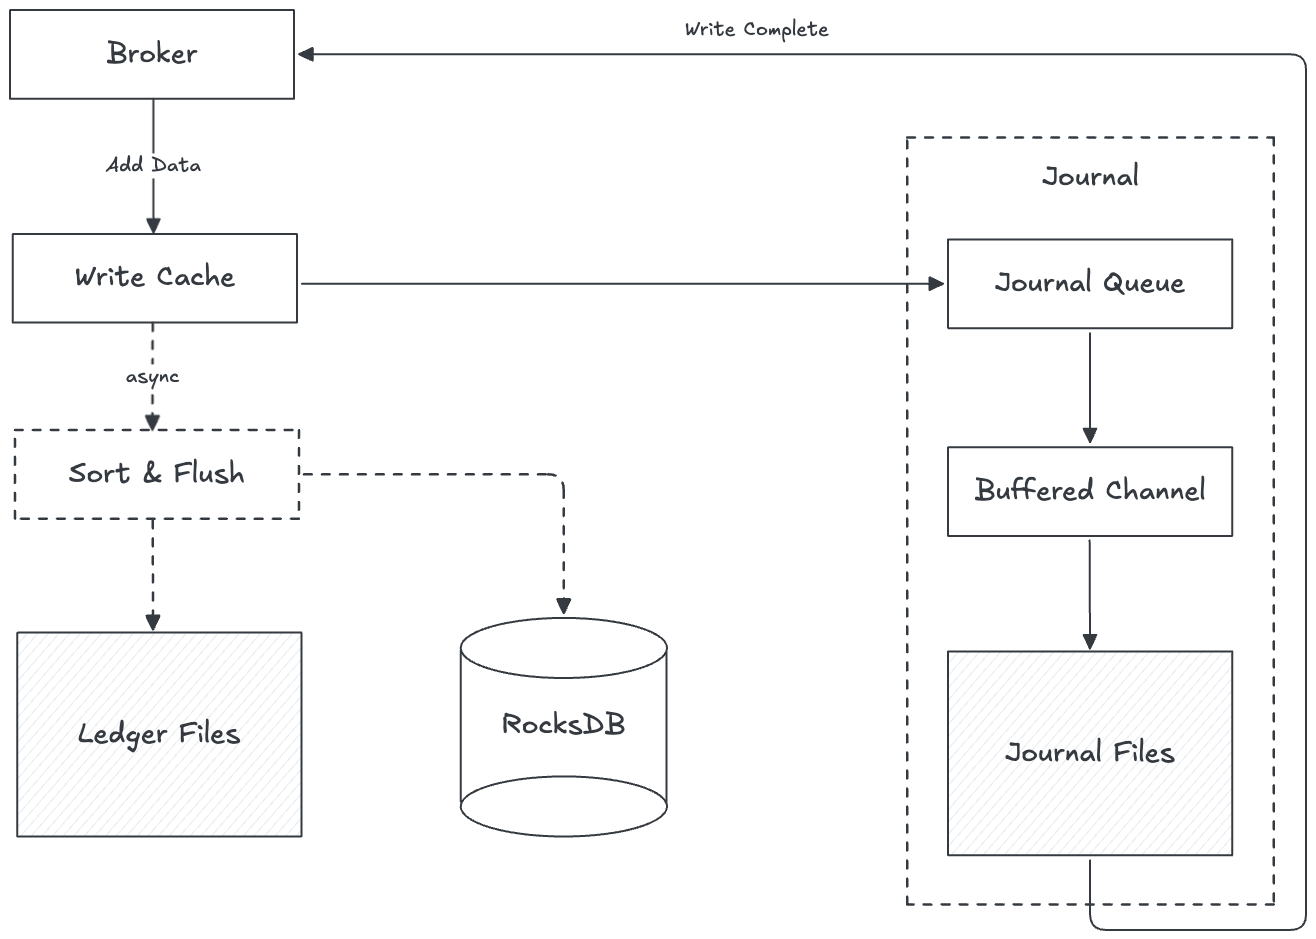
Pulsar’s data model is designed to handle millions of topics with high throughput. Each topic in Pulsar is backed by a BookKeeper ledger (an append-only log stored on bookies). Multiple ledgers are aggregated and written to ledger files in bookies (similar to a commit log in a database or RocksDB), which is optimized for sequential writes. This is illustrated in Figure 4.
- Bookies batch and sort writes to optimize disk access. Within a single topic, data is written in order, which means when that topic is consumed, the data is mostly sequential on disk. This improves read efficiency by reducing random disk seeks (fewer RocksDB lookups and disk reads).
- Bookies employ a multi-tier caching mechanism. When bookies write messages, the data is first written to a Write Cache (in-memory) as well as to the Write-Ahead Log (WAL), and later to the main ledger storage. Consumers read from the Read Cache if possible; if the data is not in cache, the consumer will query RocksDB (which indexes the ledger files) to find the data location on disk. That data is then fetched and also put into the Read Cache for future reads.
- At any given time, on each bookie disk, only one ledger file is open for writes. Each bookie also uses a RocksDB instance (for indexing entry locations). This design maximizes sequential write throughput by appending to a single file per disk at a time.
Write Process in a Bookie
When a Pulsar broker publishes a message to a topic, the message is internally forwarded to BookKeeper clients and then to the bookie storage nodes. The end-to-end write process on a bookie is illustrated in Figure 5 and described as follows (solid arrows indicate synchronous/blocking steps in the flow):
- Broker to bookies: The Pulsar broker’s BookKeeper client selects a set of bookies (the ensemble for that ledger, e.g. 2 or 3 replicas) and sends the write request to all bookies in parallel.
- Write to cache: Each bookie receives the write request and immediately writes the entry to its in-memory write cache. (By default, the write cache is sized to 1/4 of the bookie’s heap and is off-heap memory.) The write is acknowledged in memory and will be flushed to disk asynchronously (allowing batching).
- Write to WAL (Journal): If journaling is enabled (it is by default), the bookie also appends the entry to a journal file (WAL) on disk. This is done to ensure durability. The journal write is buffered and triggers a flush based on the journal’s flush policy (detailed below).
- Journal thread flush: The bookie’s Journal thread pulls pending entries from a queue and writes them into an in-memory buffer. When this buffer is full or a flush condition is met, the data is written to the OS page cache (accumulating data to eventually be written to the physical disk).
- Force write to disk: A separate ForceWrite thread is responsible for ensuring durability. It takes data that has been written to the page cache and issues an fsync (flush) to force the data to persist to the physical disk (this is often the slowest step, as it involves actual disk I/O).
- Acknowledge back to broker: Once the data is safely written (WAL fsynced) on the bookie, it sends a write acknowledgment back to the broker. After the broker receives write acknowledgments from a quorum of bookies, the broker then knows this entry is durably stored and can trigger the client’s callback to signal a successful publish.
Journal Flush Policy Tuning
Our previous analysis showed that journal flushing contributes to bookie write latency. BookKeeper flushes the journal (WAL) to disk when any of the following conditions is met (whichever comes first):
- Max wait time: 1 ms by default. The journal thread will flush the accumulated writes if 1 millisecond has passed since the last flush, even if there is little data (ensuring low latency).
- Max batch size: 512 KB of data by default. If the buffered writes reach 512KB, it will flush immediately (to optimize throughput by writing larger sequential chunks).
- Flush when idle: Disabled by default. If this is enabled, the journal will also flush as soon as the write queue becomes empty (i.e., no more writes to batch). This avoids waiting when there's a lull in traffic. We enabled this in our test to reduce latency for sporadic writes.
For our extreme latency tuning, we adjusted the bookie configuration as follows:
- Enabled force flush of journal data from page cache to disk on each flush (journalSyncData=true) to ensure data is actually on disk before acknowledging.
- Ensured the journal is actually written (journalWriteData=true, which is usually true by default).
- Enabled flushing even when the queue is not full (journalFlushWhenQueueEmpty=true), which is safe for high-IOPS SSDs. This makes even single entries get flushed without delay (useful under light load; under heavy load, the batch triggers will naturally dominate).
- Aligned the journal writes to disk sector boundaries for efficiency: we set journalAlignmentSize=4096 and readBufferSizeBytes=4096 (4 KB) to match the SSD’s physical sector size. (Note: The alignment settings require journalFormatVersionToWrite=5 or higher to take effect.)
These settings optimize the bookie to flush to NVMe disks as quickly as possible, trading off some CPU/IO overhead for the lowest possible latency.
journalSyncData=true
journalWriteData=true
journalFlushWhenQueueEmpty=true
journalAlignmentSize=4096
readBufferSizeBytes=4096
Bookie-Side Flame Graph Analysis
After applying the above optimizations, we profiled the bookie’s performance. The thread-level flame graph on the bookie side (Figure 5) showed that there were no abnormal blocking delays in the write path—each thread is doing its part efficiently. The time breakdown across key bookie threads was:
- Journal thread – ~17% of the total request latency. It spends roughly 30% of its time reading entries from the journal queue, 30% writing data into the OS page cache, and ~25% enqueueing data into the force-write queue (handing off to the ForceWrite thread).
- ForceWrite thread – ~48% of latency (this is where the heavy disk I/O happens). About 10% of its time is spent dequeuing data from the force-write queue, ~80% on forcing the data from page cache to disk (fsync calls), and ~10% handling the completion (notifying and queuing the response back to the network thread).
- Bookie I/O thread – ~28% of latency. This thread handles network I/O. Around 30% of the time goes to parsing incoming write requests and adding them to the journal queue, ~30% executing tasks in the network queue (sending the acknowledgment back to the broker), and ~30% waiting (idle or blocking on network waits).
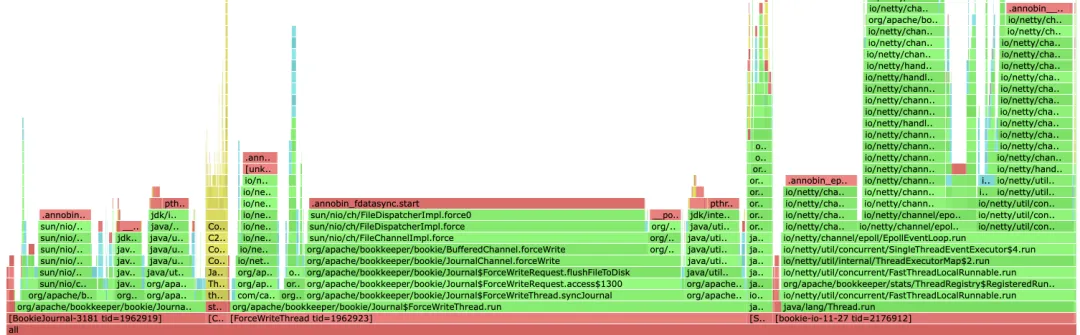
With these optimizations, the bookie effectively pipelines the work: writing to the journal and flushing to disk happens concurrently with network communication. No single thread is stalling the process significantly, and the overall bookie write path is highly efficient.
Performance Testing
Having optimized brokers and bookies for low latency, we conducted end-to-end throughput and latency tests to determine Pulsar's performance limits. To focus on single-thread performance and preserve message ordering, we utilized a single topic (partition) and producer. We tested both synchronous and asynchronous publishing modes with varying message sizes. The test environment and results are detailed below.
Test Environment: Brokers were deployed on 2 nodes (each 4 CPU cores, 16 GB RAM, 25 Gb Ethernet). Bookies were on 3 nodes (each with four 4 TB NVMe SSDs, and 25 Gb network). All nodes are deployed under the same network switch. The topic was configured with 2 bookie replicas (ensemble size=2, write quorum=2, ack quorum=2), meaning each message is written to 2 bookies and acknowledged when both succeed (for strong durability).
Before testing, we created a partitioned topic with 1 partition and set the persistence to 2 replicas and ack quorum 2:
Create a single-partition topic
bin/pulsar-admin --admin-url http://192.0.0.1:8080 topics create-partitioned-topic persistent://public/default/test_qps -p 1
Set the namespace persistence: bookie ensemble size = 2, write quorum = 2, ack quorum = 2
bin/pulsar-admin --admin-url http://192.0.0.1:8080 namespaces set-persistence public/default \
--bookkeeper-ensemble 2 \

--bookkeeper-write-quorum 2 \

--bookkeeper-ack-quorum 2
For synchronous publishing (each send waits for acknowledgment before sending the next), with pulsar-perf tool we used --batch-max-messages 1 and we used a single producer thread with no batching (to observe latency per message):
Synchronous publish, single thread, measuring latency
bin/pulsar-perf produce persistent://public/default/test_qps \
-u pulsar://192.0.0.1:6650 \
--disable-batching \
--batch-max-messages 1 \
--max-outstanding 1 \
--rate 500000 \
--test-duration 120 \
--busy-wait \
--size 1024 > sync_1024.log &
For asynchronous publishing with batching, we allowed a large batch and higher outstanding messages to maximize throughput (while preserving message order on a single thread). We also enabled compression (LZ4) to improve throughput for larger messages:
Asynchronous publish, batching and compression enabled, measuring throughput
export OPTS="-Xms10g -Xmx10g -XX:MaxDirectMemorySize=10g"
bin/pulsar-perf produce persistent://public/default/test_qps_async \
-u pulsar://192.0.0.1:6650 \
--batch-max-messages 10000 \
--memory-limit 2G \
--rate 2000000 \
--busy-wait \
--compression LZ4 \
--size 1024 > async_1024.log &
Throughput and Latency Results
After running the tests for long enough duration in each scenario, we gathered the maximum sustainable throughput (QPS) and the average latency observed, for various message sizes. The results are summarized below:
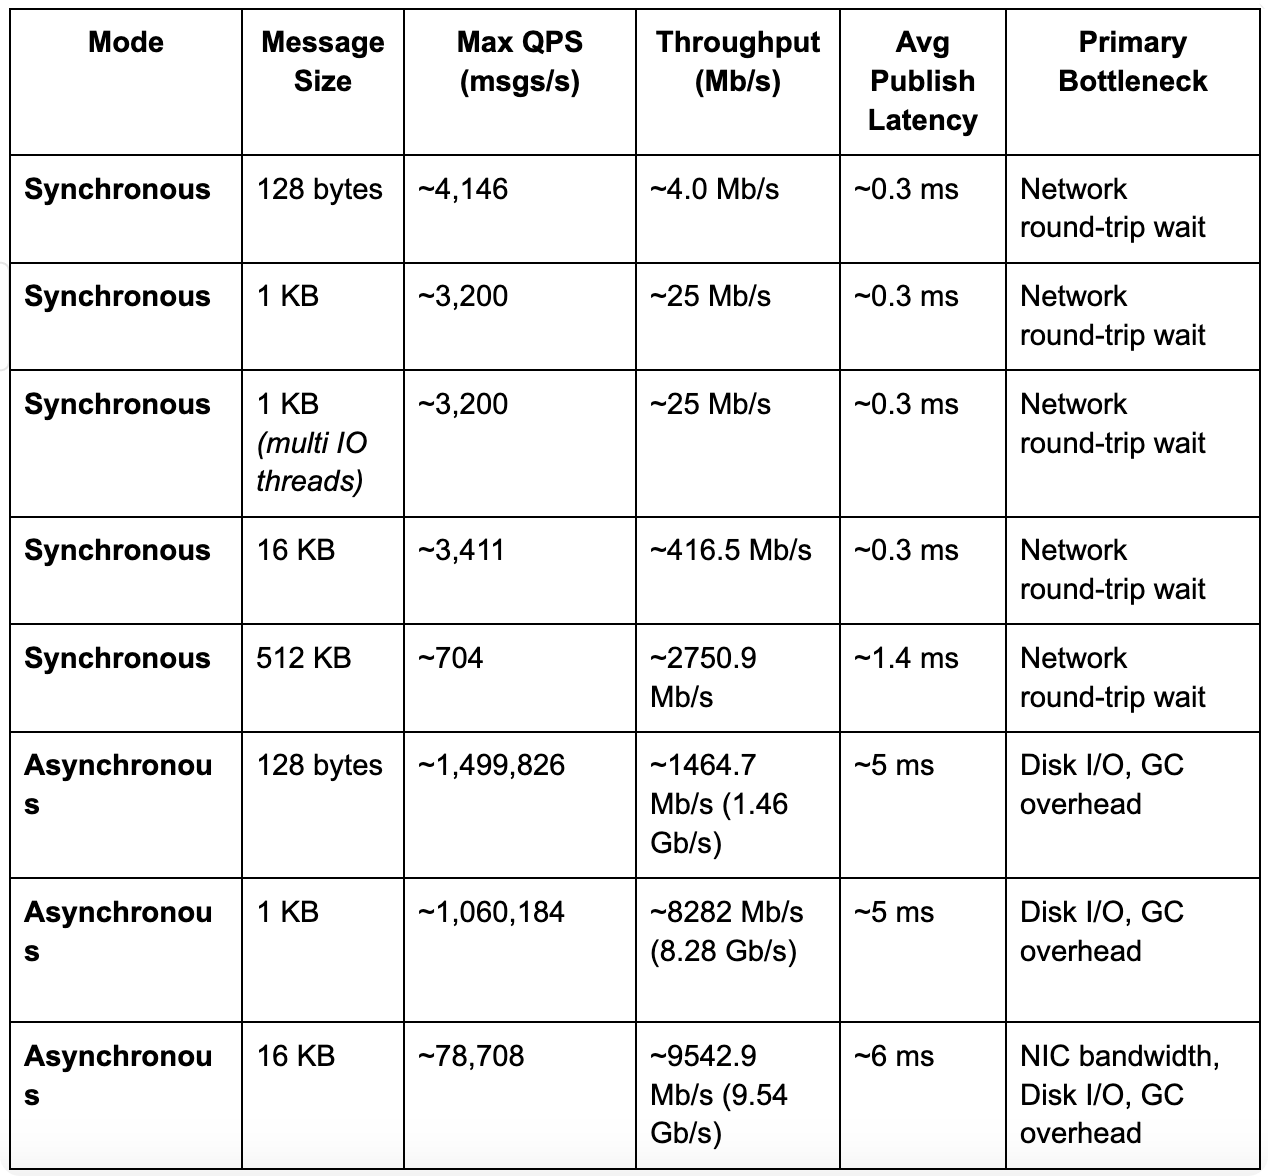
Key Takeaways:
- In synchronous mode, a single producer could send ~3200–3400 messages per second for small messages (up to 16KB), limited by the one-at-a-time round-trip to the broker. The average end-to-end latency for each message (client send -> stored on 2 bookies -> ack received) was only about 0.3 milliseconds! This is incredibly low and mainly consists of network propagation and context switching time. Even a 512 KB message was acknowledged in ~1.4 ms on average (throughput ~2.75 Gb/s), showing Pulsar’s ability to handle large messages with low latency.
- In asynchronous mode with batching, Pulsar achieved over 1 million writes per second on a single producer thread to a single topic. With 1 KB messages, we saw about 1.06 million msgs/s (~8.3 Gb/s). With compression enabled (LZ4), the throughput increased to about 1.5 million msgs/s for 128-byte messages (since compression reduces the data size, effectively pushing more messages through per second). The trade-off was a higher average latency of ~5–6 ms (because batches of messages are sent and flushed together).
- At very high QPS with small messages (128 B and 1 KB), throughput is constrained primarily by per-message CPU overhead on the broker/bookie (Netty, callbacks), callback scheduling and GC, plus the journal/force-write (fsync) pipeline on bookies — the link is not NIC-limited in these cases. As message size grows (e.g., 16 KB), the bottleneck shifts toward NIC and disk throughput, while GC remains a secondary factor. In such tests, the 25 Gb/s network was nearly saturated (e.g., ~9.5 Gb/s per bookie for 16 KB messages, which is ~19 Gb/s total for 2 bookies).
- Importantly, even in asynchronous mode, Pulsar maintains message order. The Pulsar client library and broker ensure that callbacks are executed in order for a given producer, so batching does not reorder messages. Also, using multiple threads did not improve throughput for a single topic/partition because Pulsar uses a single IO thread per partition to preserve ordering (all messages for one partition go through the same channel and IO thread).
Disk I/O Microbenchmark
To better understand the lower bound of latency, we also measured the raw disk performance for fsync on the NVMe drives. Using fio, we simulated a single-thread writing 1KB to the page cache and immediately fsyncing (forced flush to disk):
fio --name=fsync_test --filename=/data2/testfile --bs=1k --size=1k --rw=write \
--ioengine=sync --fsync=1 --numjobs=1 --iodepth=1 --direct=0 \

--group_reporting --runtime=60 --time_based
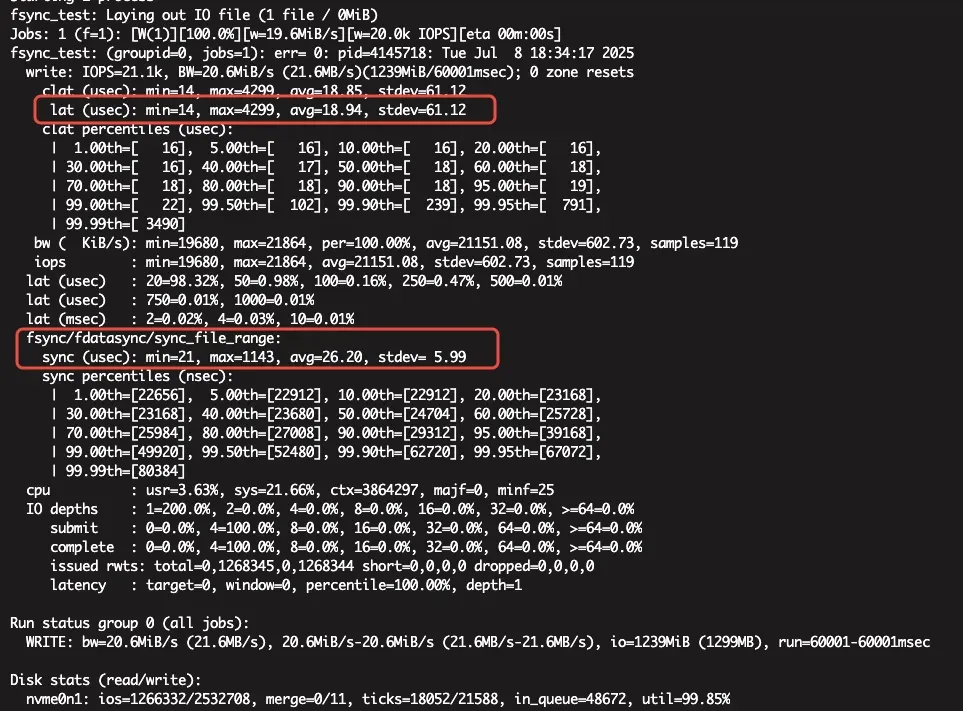
The result showed that an NVMe disk can handle a single-threaded sequential write+fsync in roughly 44 microseconds on average (about 18 µs to write to the page cache and 26 µs to flush to disk). In our Pulsar bookie tests, a single message fsync (journal write) took on the order of ~100 µs. The slight increase is due to additional overhead in the bookie (thread context switches, queue synchronization, etc., as seen in the flame graph breakdown).
Another factor in end-to-end latency is network propagation. Within the same availability zone (low network latency environment), we observed a one-way network transit time of roughly 0.05 ms (50 µs) between broker and bookie. Since our test used two bookies and required both to acknowledge, the client’s message experienced two network hops (to two bookies) plus the return hop from the broker.
Combining these factors: ~100 µs to durably write to an NVMe on each bookie, plus ~50 µs network each way, plus some processing overhead, it matches our observed ~0.3 ms end-to-end latency for a synchronous write with 2 replicas. This confirms that Pulsar’s architecture, when running on high-performance hardware (NVMe SSDs, 25GbE network), can indeed achieve sub-millisecond durable message writes.
Conclusion
This deep dive into Apache Pulsar’s performance demonstrates its ability to achieve ultra-low latency and high throughput with the right tuning and hardware. By leveraging a tiered architecture (separating compute and storage), optimizing write paths, and batching intelligently, Pulsar was able to reliably persist messages to multiple NVMe-backed replicas and acknowledge the client in about 0.3 milliseconds on average. In asynchronous mode, a single producer on one topic achieved on the order of 1 million messages per second, and up to 1.5 million msgs/s with compression, all while preserving message ordering.
Such performance is impressive for a distributed messaging system with strong durability guarantees. It showcases that Apache Pulsar’s design – with its write-ahead logs, caches, and efficient BookKeeper storage – can push the boundaries of messaging speed. For developers with demanding low-latency, high-throughput messaging needs, Pulsar’s architecture offers a compelling solution that can deliver lightning-fast data streaming without sacrificing reliability.