Authors
Mingyu Bao, Senior Software Engineer at the Tencent TEG Data Platform Department. He is responsible for the development of projects like Apache Pulsar, Apache Inlong, and DB data collection. He is focused on big data and message middleware, with over 10 years of experience in Java development.
Dawei Zhang, Apache Pulsar Committer, Senior Software Engineer at the Tencent TEG Data Platform Department. He is responsible for the development of the Apache Pulsar project. He is focused on MQ and real-time data processing, with over 6 years of experience in big data platform development.
Background
Tencent is a world-leading internet and technology company that develops innovative products and services for users across the globe. It provides communication and social services that connect more than one billion people around the world, helping them to keep in touch with friends and family members, pay for daily necessities, and even be entertained.
To offer a diverse product portfolio, Tencent needs to stay at the forefront of technological innovations. At Tencent, the Technology Engineering Group (TEG) is responsible for supporting the company and its business groups in technology and operational platforms, as well as the construction and operation of R&D management and data centers.
Recently, an internal team working on messaging queuing (MQ) solutions at TEG developed a performance analysis system (referred to as the “Data Project” in this blog) for maintenance metrics. This system provides general infrastructure services to the entire Tencent group. The Data Project collects performance metrics and reports data for business operations and monitoring. It may also be adopted for real-time analysis at both the front end and back end in the future.
The Data Project uses Apache Pulsar as its message system with servers deployed on Cloud Virtual Machines (CVM), and producers and consumers deployed on Kubernetes. The Pulsar clusters managed by the Data Project produce a greater number of messages than any other cluster managed by the MQ team. Due to the large cluster size, we have faced specific challenges and hope to share our learnings and best practices in this post.
High system reliability and low latency: Why Apache Pulsar
Our use case has the following two important characteristics:
- Large message volumes. The Data Project is running with a large number of nodes to handle numerous messages every day with up to thousands of consumers bound to a single subscription. While we don’t have too many topics in total, each topic is connected to multiple clients. Each partition is attached to over 150 producers and more than 8000 consumers.
- Strict requirements for high system reliability and low latency. With such large clusters to maintain, we must stick to higher standards of deployment, operations, and stability.
Therefore, when selecting potential message solutions, we put low latency and high throughput as key metrics for analysis. Compared with some of the common message systems in the market, ultimately Apache Pulsar stood out with its outstanding performance and capabilities.
Pulsar provides different subscription types, namely exclusive, failover, shared, and key_shared. Shared and key_shared subscriptions are able to support use cases where a large number of consumers are working at the same time. This is where other message systems like Kafka fall short. They function with rather low performance in a multi-partition scenario as consumers are restricted by the number of partitions.
Configurations at a glance: Large clusters with over 100 billion messages per day
Now that we know the reason behind our preference for Pulsar, let’s look at how we configured our cluster to take full advantage of it.
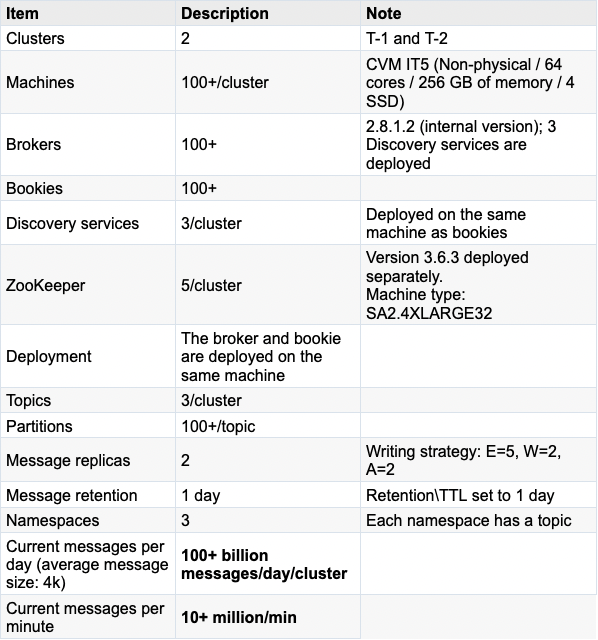
The business data in the Data Project are handled by two Pulsar clusters, which we will refer to as T-1 and T-2 in this blog. The client Pods (producers and consumers are deployed in different Kubernetes Pods) that connect to cluster T-1 are placed in the same server room as the Pulsar cluster. The client Pods that interact with cluster T-2 are deployed in different server rooms from the Pulsar cluster. Note that the latency of data transmission across different server rooms is a little bit higher than that in the same server room.
Server-side configurations
Client-side configurations
Developed in Go, the business system of the Data Project is built on the master branch (latest version) of the Pulsar Go Client, deployed on STKE (Tencent’s internal container platform).
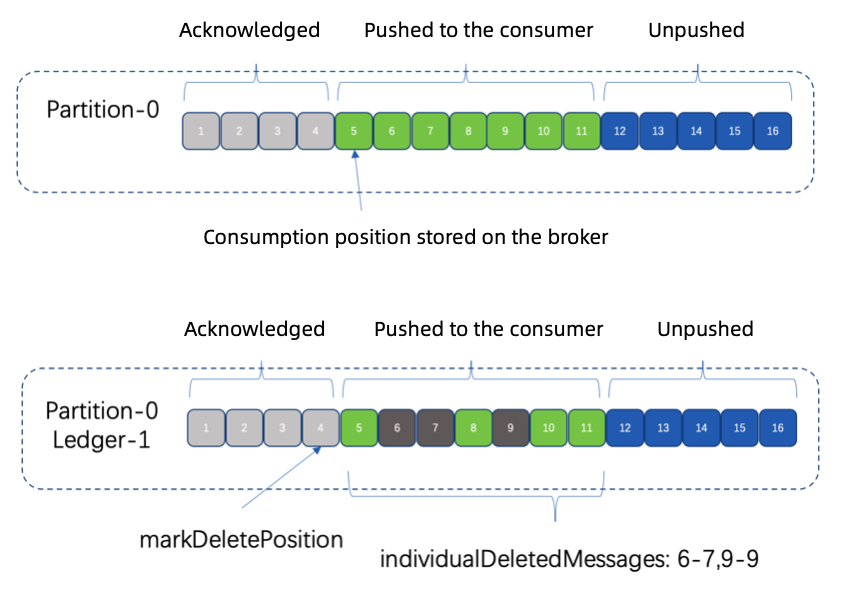
When pushing messages to the client with a shared type subscription, brokers only send a subset of the messages to each consumer in a round-robin distribution. After each consumer acknowledges their messages, you can see that there is plenty of range information as shown below stored on the broker.

An acknowledgment hole refers to the gap between two consecutive ranges. Its information is stored through the individualDeletedMessages attribute. The number of consumers attached to the same subscription and their consumption speed can all impact acknowledgment holes. A larger number of acknowledgment holes could mean that you have plenty of acknowledgment information.
Pulsar periodically aggregates all acknowledgment information of all consumers associated with the same subscription as an entry and writes it to bookies. The process is the same as writing ordinary messages. Therefore, when you have too many acknowledgment holes and large amounts of acknowledgment information, your system might be overwhelmed. For example, you might notice a longer production time, latency spikes, or even timeouts on the client side.
In these cases, you can reduce the number of consumers, increase the consumption speed, adjust the frequency of storing acknowledgment information, and change the number of saved ranges.
Analysis 2: The pulsar-io thread gets stuck
The pulsar-io thread pool is used to process client requests on Pulsar brokers. When threads are too slow or get stuck, there might be timeouts or disconnections on the client side. We can identify and analyze these problems through jstack information, which displays that there can be many connections in the CLOSE_WAIT state on brokers as shown below:
36          0 :6650           :57180         CLOSE_WAIT    20714/java
36          0 :6650           :48858         CLOSE_WAIT    20714/java
36          0 :6650           :49846         CLOSE_WAIT    20714/java
36          0 :6650           :55342         CLOSE_WAIT    20714/java
Usually, these can be caused by server code bugs (such as deadlocks in some concurrent scenarios), while configurations could also be a reason. If the pulsar-io thread pool has been running for a long time, you can modify the numioThreads parameter in broker.conf to change the number of working threads in the pool on the premise that you have sufficient CPU resources. This can help improve performance in concurrent tasks.
A busy pulsar-io thread pool is essentially not going to cause problems. Nevertheless, on the broker side, there is a background thread periodically checking if each channel is receiving requests from the client within the expected threshold. If not, the broker will close the channel (similar logic also exists in the client SDK). This is why a client is disconnected when the pulsar-io thread pool gets stuck or slows down.
Analysis 3: Excessive time consumption in ledger switching
As a logic storage unit in Apache BookKeeper, each ledger stores a certain number of log entries, and each entry contains one or multiple messages (if message batching is enabled). When certain conditions are met (for example, the entry number, total message size, or lifespan reaches the preset threshold), a ledger is switched (ledger rollover).
Here’s what it looks like when ledger switching takes too much time:
14:40:44.528 [bookkeeper-ml-workers-OrderedExecutor-16-0] INFO org.apache.pulsar.broker.service.Producer - Disconnecting producer: Producer{topic=PersistentTopic{topic=persistent://}, client=/:51550, producerName=}
14:59:00.398 [bookkeeper-ml-workers-OrderedExecutor-16-0] INFO org.apache.bookkeeper.mledger.impl.OpAddEntry - Closing ledger 7383265 for being full
$ cat pulsar-broker-11-135-219-214.log-11-05-2021-2.log | grep ‘bookkeeper-ml-workers-OrderedExecutor-16-0’ | grep ‘15:0’ | head -n 10
15:01:01:256 [bookkeeper-ml-workers-OrderedExecutor-16-0] INFO org.apache.bookkeeper.mledger.impl.ManagedLedgerImpl - [
] Ledger creation was initiated 120005 ms ago but it never completed and creation timeout task didn’t kick in as well. Force to fail the create ledger operation.
15:01:01:256 [bookkeeper-ml-workers-OrderedExecutor-16-0] ERROR org.apache.bookkeeper.mledger.impl.ManagedLedgerImpl - [] Error creating ledger rc=-23 Bookie operation timeout
When ledger switching happens, new messages or existing ones that are yet to be processed will go to appendingQueue. After the new ledger is created, the system can continue to process data in the queue, thus making sure no messages are lost.
When ledger switching takes a longer time, it means that messages are produced slowly or that there could be timeouts. In this case, you need to check whether this is a ZooKeeper issue (pay more attention to the performance of machines running ZooKeeper and garbage collection).
Analysis 4: Busy bookkeeper-io thread
In our current Pulsar clusters, we are using a relatively stable version of BookKeeper. To optimize performance, you can modify the number of client threads and key configurations (for example, ensemble size, write quorum, and ack quorum).
If you notice that the bookkeeper-io thread pool of the BookKeeper client is busy or a single thread in the pool is busy, you need to first check ZooKeeper, bookie processes, and Full GC. If there is no problem, it may be a good idea to change the number of threads in the bookkeeper-io thread pool and the number of partitions.
Analysis 5: DEBUG logging impact
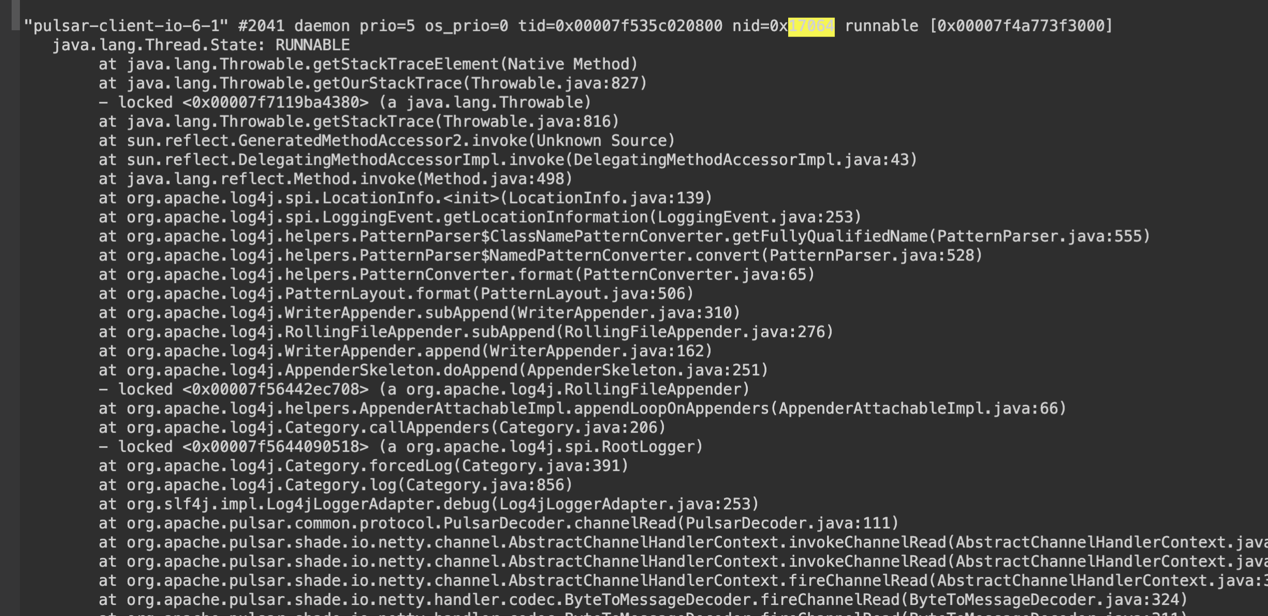
If producers spend too much time producing messages, the Java client is usually where the issue exists in terms of logging levels. If Log4j is adopted in your business system with debug logging enabled, the performance of Pulsar Client SDK might be impacted. Therefore, we suggest that you use the Pulsar Java app coupled with Log4j or Log4j plus SLF4J for logging. At the same time, change your logging level to at least INFO or ERROR for your Pulsar package.
In extreme cases, DEBUG logs may affect thread performance, which could mean a longer time (second-level) in producing messages. After optimization, it can fall back to the normal level (millisecond-level). See Figure 3 below for details:
When you have a large number of messages, you may want to disable DEBUG level log printing on brokers and bookies for your Pulsar cluster. It is also recommended to change the logging level to INFO or ERROR.
Analysis 6: Uneven partition distribution
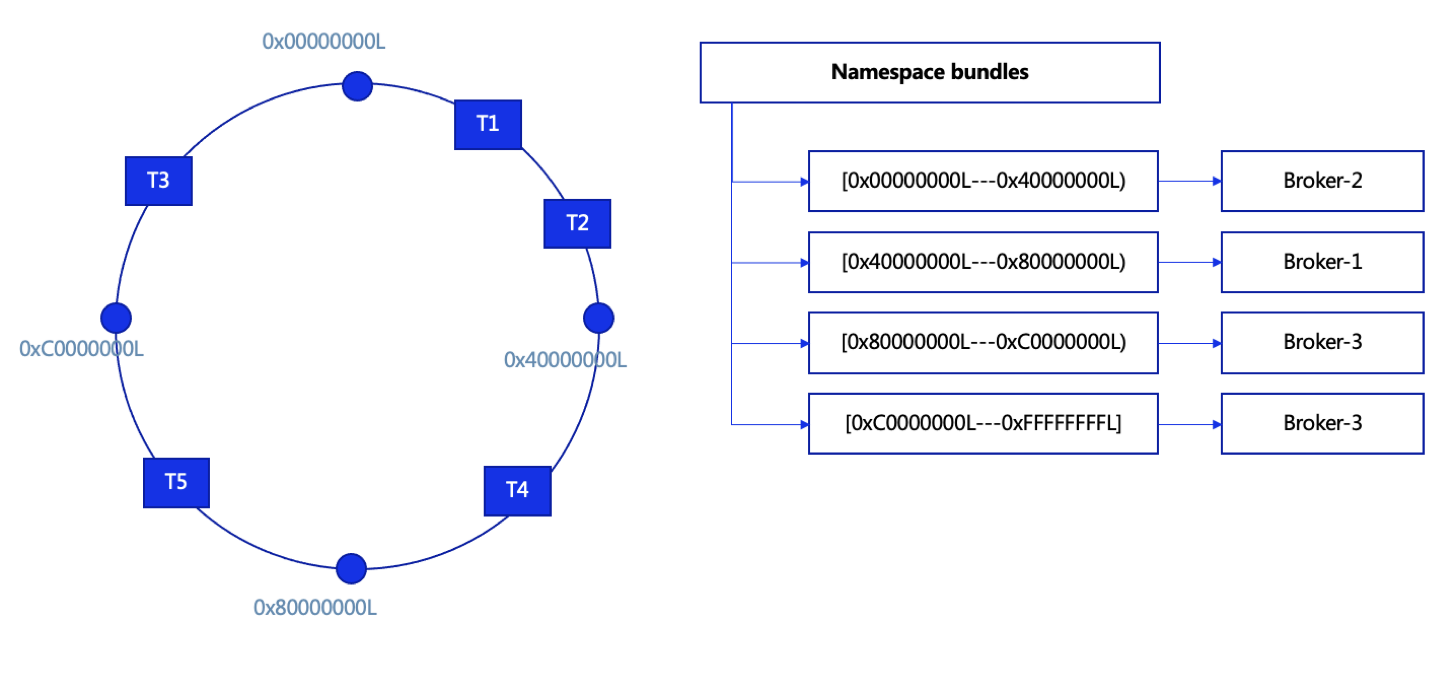
In Pulsar, we can configure bundles in each namespace (4 bundles by default) as shown below. Topics are assigned to a particular bundle by taking the hash of the topic name and checking which bundle the hash falls into. Each bundle is independent of the others and thus is independently assigned to different brokers. When too many partitions fall into the same broker, it becomes overloaded, which impairs the efficiency of producing and consuming messages.
Note that:
- Each namespace has a bundle list.
- Partitions fall into different bundles based on the hash value.
- Each bundle is bound to a single broker.
- Bundles can be dynamically split, which is configurable.
- Bundles and brokers are bound based on the brokers' load.
When the Data Project started, there were only a few partitions in each topic and a few bundles in each namespace. As we modified the number of partitions and bundles, we gradually achieved load balancing across brokers.
Pulsar still has room for improvement in dynamic bundle splitting and partition distribution, especially the splitting algorithm. It currently supports range_equally_divide (default) and topic_count_equally_divide (We suggest using the latter). That said, the improvement needs to be carried out without compromising system stability and load balancing.
Optimization 2: Frequent client disconnections and reconnections
There are various reasons for disconnections and reconnections. Based on our own use case, we have summarized the following major causes.
- Client disconnection and reconnection mechanism
- Go SDK exception handling
- Go SDK producer sequence id inconsistency
- Consumers were frequently created and deleted at scale
Now, let’s analyze each of these causes and examine some solutions.
Analysis 1: Client disconnection and reconnection mechanism
The Pulsar client SDK has similar logic (see Analysis 2 in the previous section above) that periodically checks if requests from the server within the expected threshold are received. If not, the client will be disconnected from the server.
Usually, the problem could be a lack of resources on client machines that already have a high utilization rate (and let’s assume there is nothing wrong with the server). This means your application is not able to handle the data from the server. To solve this, change the business logic or the deployment method of your client.
Analysis 2: Go SDK exception handling
The Pulsar community provides integration support for clients in different languages, such as Java, Go, C++, and Python. However, besides Java and Go, the implementation of other languages still needs to be improved. Compared with the SDK for Java, the SDK for Go needs to be more detail-oriented.
When receiving an exception from the server, the Java SDK is able to identify whether the channel should be deleted or not for the exception (for example, ServerError_TooManyRequests) and recreate it if necessary. By contrast, the Go client deletes the channel directly and recreates it.
Analysis 3: Go SDK producer sequence id inconsistency
After sending messages, a Go SDK producer (written with a relatively low version) will receive broker responses. If the sequenceID in the responses is not consistent with the sequenceID at the front of the queue on the client, it will result in a disconnect.
In higher Go SDK versions, this issue and the one mentioned in Analysis 1 have been properly handled. Therefore, it is suggested that you choose the latest version of Go SDK. If you are interested, you are welcome to make contributions to the development of Pulsar Go SDK.
Analysis 4: Consumers were frequently created and deleted at scale
In cluster maintenance, we adjusted the number of partitions to meet the growing business demand. The client, which did not restart, noticed the change on the server, thus creating new consumers for new partitions. We found that this was caused by an SDK bug in Java 2.6.2. Because of the bug, the client could repeatedly create a great number of consumers and delete them. To solve this, we suggest you upgrade your Java client.
In addition, our client Pods once had a similar issue of frequent restarts. After troubleshooting, we found that this was a panic error. As such, we advise you to take fault tolerance into consideration for your logic implementation to avoid potential problems.
Optimization 3: Upgrade ZooKeeper
Initially, we were using ZooKeeper 3.4.6 while a bug as shown in the figure below continuously occurred.
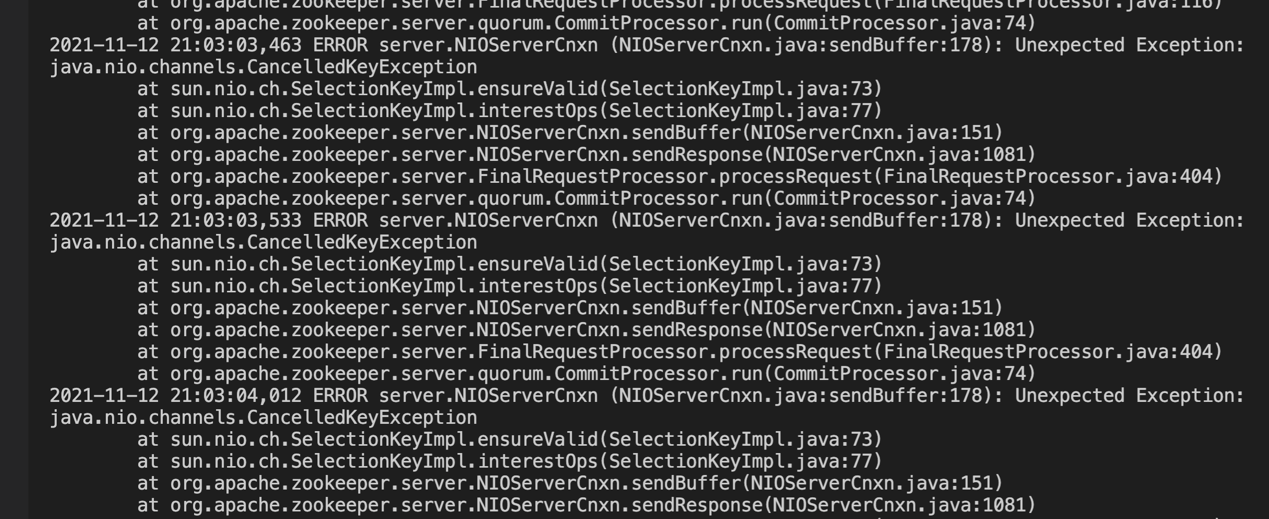 Figure 5
The bug was later fixed. For more information, see the Apache Zookeeper issue. Therefore, we suggest that you apply a patch to fix it or upgrade ZooKeeper. In the Data Project, we upgraded to 3.6.3 and the issue was resolved.
Pulsar cluster maintenance guidance
In cluster maintenance, there might be issues of timeouts, slow message production and consumption, and large message backlogs. To improve troubleshooting efficiency, you can get started with the following perspectives:
- Cluster resource configurations
- Client message consumption
- Message acknowledgment information
- Thread status
- Log analysis
Let’s take a closer look at each of them.
Cluster resource configurations
First, check whether the current resource configurations are sufficient to help your cluster handle the workload. This can be analyzed by checking CPU, memory, and disk IO information of brokers, bookies, and ZooKeeper on the Pulsar cluster dashboard. Second, check the GC state of Java processes, especially those with frequent Full GC. Make timely decisions to put more resources into your cluster if necessary.
Client message consumption
The client may have a backpressure issue resulting from a lack of consumption activities. In this scenario, message reception is rather slow or no messages can be received even though there are consumer processes.
You can use the pulsar-admin CLI tool to see detailed statistics of the impacted topic (pulsar-admin topics stats). In the output, pay special attention to the following fields:
- unackedMessages: The number of delivered messages that are yet to be acknowledged.
- msgBacklog: The number of messages in the subscription backlog that are yet to be delivered.
- type: The subscription type.
- blockedConsumerOnUnackedMsgs: Whether or not the consumer is blocked because of too many unacknowledged messages.
If there are too many unacknowledged messages, it will affect message distribution from brokers to the client. This is usually caused by code in the business application, resulting in messages not getting acknowledged.
Message acknowledgment information
If producers spend too much time producing messages, check your system configurations as well as acknowledgment hole information. For the latter, use pulsar-admin topics stats-internal to see the status of a topic and check the value of the field individuallyDeletedMessages in the subscription.
Pulsar uses a ledger inside BookKeeper (also known as the “cursor ledger”) for each subscriber to track message acknowledgments. After a consumer has processed a message, it sends an acknowledgment to the broker, which then updates the cursor ledger for the consumer’s subscription. If there is too much acknowledgment information sent for storage, it will put greater pressure on bookies, increasing the time spent producing messages.
Thread status
You can check the status of threads running on brokers, especially the pulsar-io, bookkeeper-io, and bookkeeper-ml-workers-OrderedExecutor thread pool. It is possible that some thread pools do not have sufficient resources or a thread in a certain pool has been occupied for a long time.
To do so, use the top -p PID H command to list the threads with high CPU usage and then locate the specific thread based on the jstack information.
Log analysis
If you still cannot find the reason for your problem, check logs (for example, those in clients, brokers, and bookies) in detail. Try to find any valuable information and analyze it while also taking into account the features of your business, scenarios when the problem occurs, and recent events.
Looking ahead
In this post, we have analyzed some common issues we faced in our deployment regarding cluster maintenance and detailed solutions that worked for us. As we continue to work on cluster optimization and make further contributions to the community, we hope these insights provide a solid foundation for future work.
In our use case, for example, we have a considerable number of clients interacting with a single topic, which means there are numerous producers and consumers. This has further raised the bar for the Pulsar SDK, which needs to be more detail-oriented. Even a trivial issue that may lead to disconnections or reconnections could affect the entire system. This is also where the Pulsar Go SDK needs to be continuously upgraded. In this connection, the Tencent TEG MQ team has been an active driving force to work with the community in improving the Pulsar Go SDK.
Additionally, our Data Project contains a large amount of metadata information that needs to be processed on brokers. This means that we have to keep improving broker configurations and making adjustments to further enhance reliability and stability. In addition to scaling machines with more resources, we also plan to optimize configurations in Pulsar read/write threads, entry caches, bookie write/write caches, and bookie read/write threads.
More resources
- Make an inquiry: Interested in a fully-managed Pulsar offering built by the original creators of Pulsar? Contact us now.
- Pulsar Summit Europe 2023 is taking place virtually on May 23rd. Engage with the community by submitting a CFP or becoming a community sponsor (no fee required).
- Learn the Pulsar Fundamentals: Sign up for StreamNative Academy, developed by the original creators of Pulsar, and learn at your own pace with on-demand courses and hands-on labs.
- Read the 2022 Pulsar vs. Kafka Benchmark Report for the latest performance comparison on maximum throughput, publish latency, and historical read rate.


