January 4, 2023
12 min read

WeChat: Using Apache Pulsar to Support the High Throughput Real-time Recommendation Service

Picture of Shen Liu from streamnative
Shen Liu

WeChat is a WhatsApp-like social media application developed by the Chinese tech giant Tencent. According to a recent report, WeChat provided services to 1.26 billion users in Q1 2022, with 3.5 million mini programs on its platform.

As shown in Figure 1, WeChat has multiple business scenarios, including recommendations, risk control, monitoring, and AI platform. In our service architecture, we ingest data through Software Development Kits (SDKs) or data collection tools, and then distribute them to messaging platforms such as Kafka and Pulsar. Ultimately, they are processed and stored by different downstream systems. For computing, we use Hadoop, Spark, ClickHouse, Flink, and Tensorflow; for storage, we use HDFS, HBase, Redis and self-developed key-value databases.
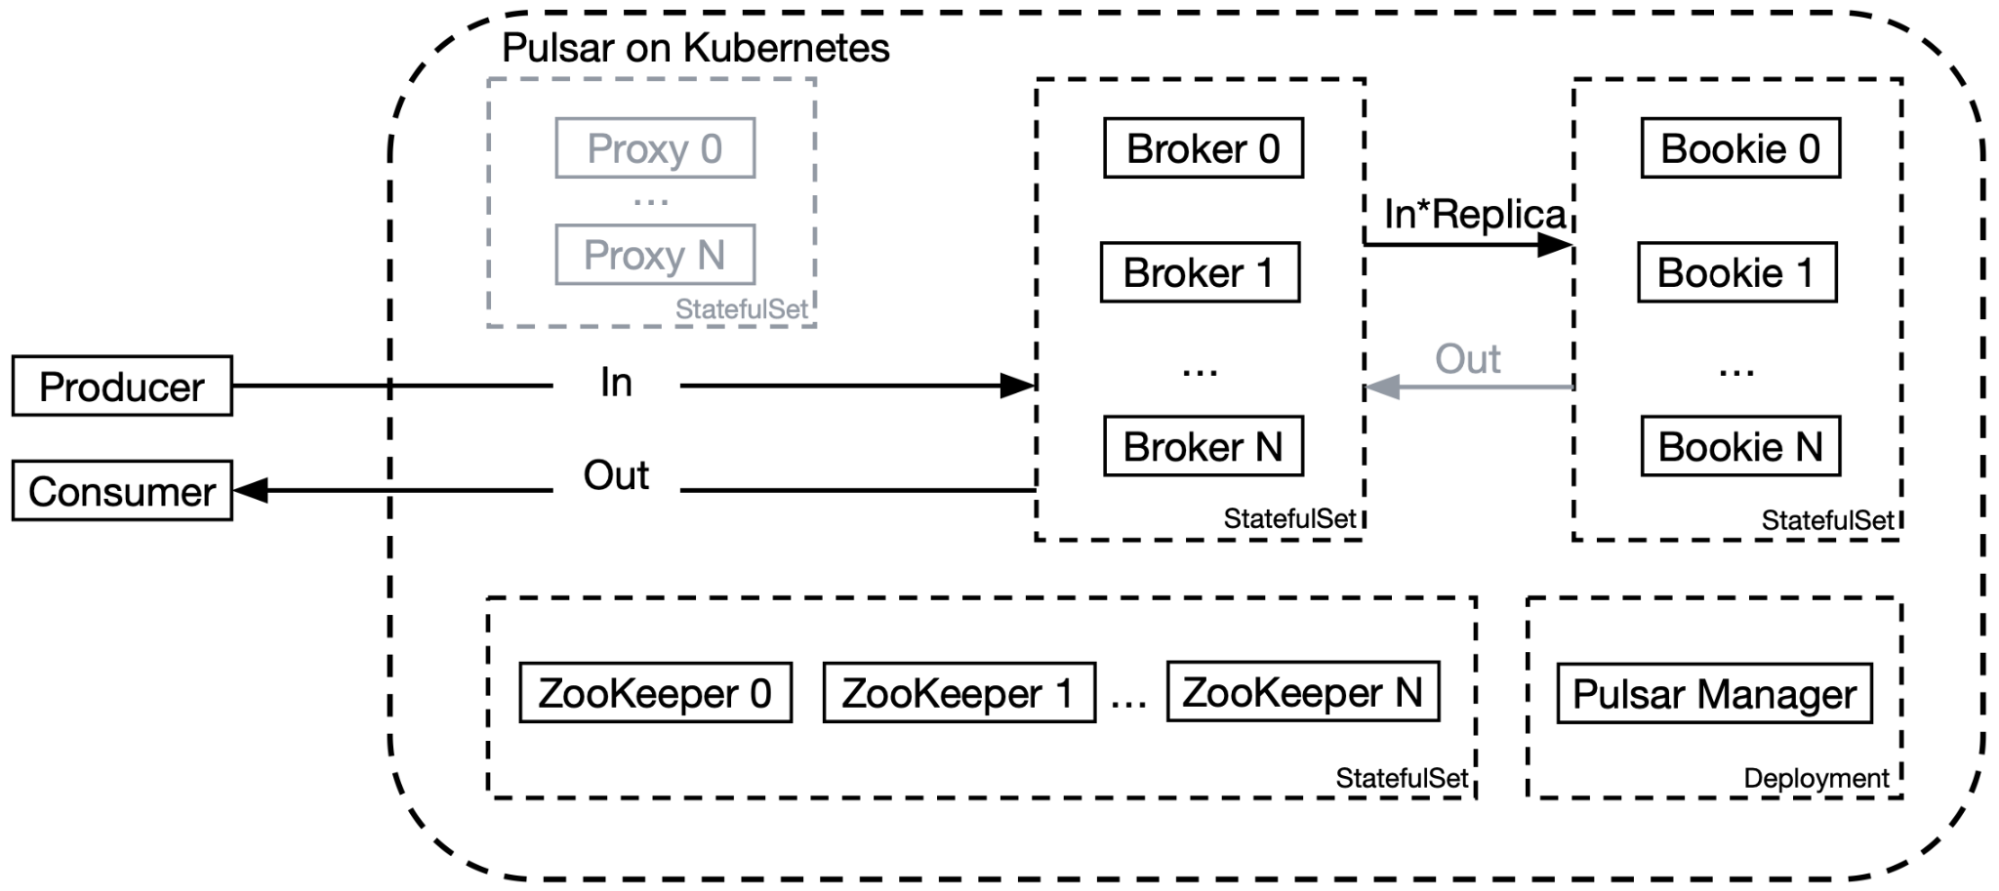
Figure 1. Service architecture of WeChat

In this blog, I will first explain our motivation for selecting Apache Pulsar, and then share some of the practices of implementing Pulsar in our real-time recommendation service with some performance tuning tips.

Why Apache Pulsar

We started our exploration of Apache Pulsar when we decided to build a message queuing system that is capable of handling large-scale traffic and is easy to use and maintain. After evaluating some of the most popular messaging tools, we were confident that Pulsar would be the best choice for our message queuing platform. Pulsar’s most attractive features to us are the following.

  • Cloud-native architecture. Pulsar uses a multi-layer approach to separating compute from storage. It features great scalability, strong fault tolerance, and high availability. These make it a perfect fit for our cloud infrastructure.
  • Elegant resource isolation. Pulsar achieves this through a three-level hierarchy structure: tenant, namespace, and topic. One business line can use one tenant, and namespaces are administrative units of topics. This allows Pulsar operators to have full control of different resources as they allocate them to specific tenants.
  • Flexible strategy management. The namespace/topic management strategies in Pulsar simplify the operations and maintenance of the cluster. For example, both retention and TTL policies can be set at namespace and topic levels.
  • Independent scalability. Both brokers and bookies can be scaled instantly as needed without impacting downstream business. As such, Pulsar enables us to gracefully deal with traffic upsurges and avoid waste of resources.
  • Multi-language client libraries. WeChat’s business modules are implemented in multiple languages, such as C/C++ and Python. In this connection, Pulsar can be easily integrated into our system due to its multi-language support.

In our test environment, Pulsar delivered great performance and achieved what we aimed for. Therefore, we started deploying it in production. During this process, we encountered some issues and would like to share our experiences in finding the solutions.

Practice 1: Deploying Apache Pulsar on Kubernetes

We deployed Pulsar on Kubernetes using the Pulsar Helm chart provided by the Pulsar community. As shown in Figure 2, in the original architecture of Pulsar on Kubernetes, data flows in from the proxy layer to the serving layer (brokers), and finally is stored on bookies. The proxies are responsible for the indirect interaction between the client and the brokers. The brokers manage topics, and the bookies persist messages.

Figure 2. The original architecture of Pulsar on Kubernetes

Two problems occurred when we implemented Pulsar in our system using this architecture.

  • As Pulsar proxies serve as a traffic gateway, the brokers cannot directly obtain the original IP address of requests, namely the client’s IP address. This causes extra difficulties in terms of operations and maintenance.
  • When the traffic within the cluster jumps, the intra-cluster bandwidth becomes a bottleneck. Figure 2 depicts the inflow and outflow traffic between the components inside the cluster. Suppose the speed of data flowing in and out is both 10 Gbps and the number of replicas is 3, then the actual inflow speed would be 50 Gbps and the actual outflow speed could be 30 Gbps (the traffic from bookies to brokers may not be needed as brokers have caches for messages, but in some cases it is possible) inside the cluster. Another possible reason for this bottleneck is that by default, the proxy layer only uses one load balancer. When all the incoming data goes through it, the load balancer becomes the bottleneck of the cluster since it is under enormous traffic pressure.

It can be seen that the proxy layer leads to extra traffic within the Kubernetes cluster. Essentially, the Pulsar proxy is designed as a bridge between the client and the brokers, which is very useful when direct interaction is not possible (for example, a private network scenario). In our case, however, there are tons of data coming in and out of the cluster, putting extra pressure on the proxies. To resolve this issue, we made the following improvements.

  • Removed the proxy layer and exposed the brokers’ IP address outside the cluster through an elastic network interface, so that it is accessible to external clients.
  • Configured a load balancer for the brokers’ Service. This way, external clients can connect to the Pulsar cluster through the load balancer’s IP address and then locate the brokers serving the target topics using the lookup mechanism.
Figure 3. The redesigned architecture of Pulsar on Kubernetes

Apart from our efforts to remove the proxy layer for better bandwidth utilization, we also optimized our Pulsar deployment on Kubernetes in the following ways.

  • Improved bookies’ performance by using a multi-disk and multi-directory solution with local SSDs. We contributed this enhancement to the Pulsar community. See PR-113 for details.
  • Integrated the Tencent Cloud Log Service (CLS) as a unified logging mechanism to simplify log collection and query operations, as well as the use and maintenance of the whole system.
  • Combined Grafana, Kvass, and Thanos with a distributed Prometheus deployment for metric collection to improve performance and support horizontal scaling. Note that for the default Pulsar deployment, Prometheus is used as a standalone service but it is not applicable to our case given the high traffic volume.

Practice 2: Using non-persistent topics

Apache Pulsar supports two types of topics: persistent topics and non-persistent topics. The former persists messages to disks whereas the latter only stores messages temporarily. Figure 4 compares how these two types of topics work in Pulsar. For persistent topics, producers publish messages to the dispatcher on the broker. These messages are sent to the managed ledger and then replicated across bookies via the bookie client. By contrast, producers and consumers working on non-persistent topics interact with the dispatcher on the broker directly, without any persistence in BookKeeper. Such straight communication has lower requirements for the bandwidth within the cluster.
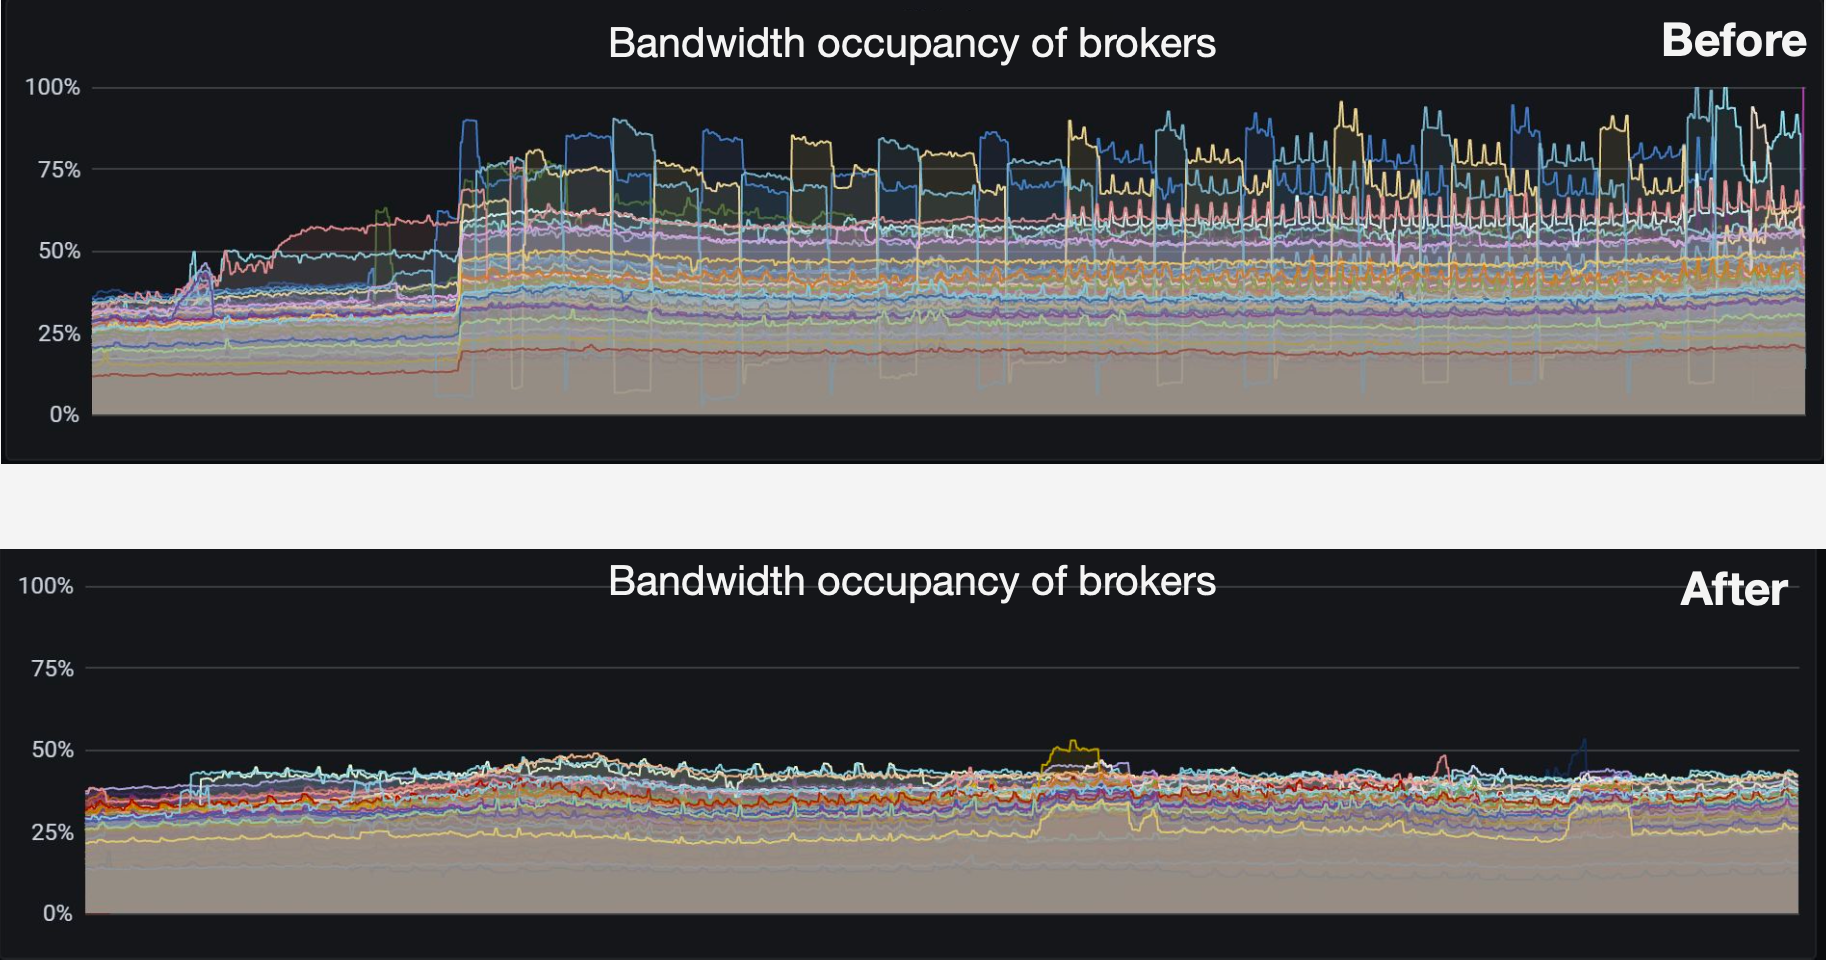
Figure 4. Persistent topics vs. non-persistent topics

The value of non-persistent topics can be highlighted in dealing with high throughput and real-time use cases. However, data loss might occur when you are using non-persistent topics (for example, the broker restarts or crashes). This is why we only use them in a limited number of scenarios, such as:

  • High-throughput real-time training tasks with low processing efficiency on the consumer side
  • Time-sensitive real-time training tasks
  • Sampled evaluation tasks

Practice 3: Optimizing the broker load shedding logic

Pulsar has an automatic load shedding mechanism to prevent a broker from becoming overloaded by forcing the extra traffic to be redistributed to other available brokers. In one of our production cases, bundles were unloaded repeatedly due to this mechanism, resulting in broker load fluctuations (blue and yellow lines in Figure 5).

Figure 5 displays the broker bandwidth occupancy inside the cluster. In this scenario, we were using the following load shedding configurations:

loadManagerClassName=org.apache.pulsar.broker.loadbalance.impl.ModularLoadManagerImpl
loadBalancerLoadSheddingStrategy=org.apache.pulsar.broker.loadbalance.impl.ThresholdShedder
loadBalancerBrokerThresholdShedderPercentage=10
loadBalancerBrokerOverloadedThresholdPercentage=70
Load bundle class: org.apache.pulsar.broker.loadbalance.impl.LeastLongTermMessageRate
Figure 5. Bandwidth occupancy of brokers

Let’s take a closer look at this issue. Figure 6 is an example of load shedding across brokers. Suppose the loads on broker 1, broker 2, and broker 3 are 80%, 60%, and 10% respectively, then the average load is 50%. As the load shedding threshold for these brokers is 10% (controlled by loadBalancerBrokerThresholdShedderPercentage as shown in the above configuration), the part beyond 60% (50%+10%) on any broker will be rebalanced to other brokers. We would expect broker 3 to take the unloaded bundle from broker 1, but in our case, the load was actually migrated to broker 2, making it overloaded. Likewise, the exceeded load on broker 2 was rebalanced back to broker 1. After we checked the logs, we noticed that the extra traffic was moved back and forth between broker 1 and broker 2. This was contradictory to our expectation of broker 3 to handle the extra load.

We inspected the source code and found that the issue resulted from the default behavior of LeastLongTermMessageRate, which selects the broker to take the excess traffic by the number of messages (see PIP-182 for details). In other words, brokers serving lower message volumes should be the candidate to handle the extra traffic. However, lower message volumes do not necessarily mean lower loads. Additionally, we were using the ThresholdShedder strategy, which calculates the broker load based on different factors, including CPU, inflow and outflow traffic, and memory. In short, the logic implementations for loading and unloading bundles are different.

To solve this issue, we updated the shedding logic by introducing loadBalancerDistributeBundlesEvenlyEnabled in ServiceConfiguration. It defaults to true, and we set it to false, which means the broker to handle the surplus traffic will be randomly selected from the ones with lower loads than the average load. For details, see PR-16059 and PR-16281. Figure 7 displays the bandwidth occupancy of the brokers after this improvement.

Figure 7. Bandwidth occupancy of brokers with the updated logic

Practice 4: Increasing the cache hit ratio

In Pulsar, brokers cache data to memory to improve reading performance, as consumers can retrieve data from these caches directly without going further into BookKeeper. Pulsar also allows you to set a data eviction strategy for these caches with the following configurations, among others:

  • managedLedgerCacheSizeMB: The amount of memory used to cache data.
  • managedLedgerCursorBackloggedThreshold: The number of entries from the position where a cursor should be considered as inactive.
  • managedLedgerCacheEvictionTimeThresholdMillis: The time threshold of evicting all cached entries.

The following code snippet shows the original logic of cache eviction:

void doCacheEviction(long maxTimestamp) {
    if (entryCache.getsize() <= 0) {
        return;
    }

    // Always remove all entries already read by active cursors
    PositionImpl slowestReaderPos = getEarlierReadPositionForActiveCursors();
    if (slowestReaderPos != null) {
        entryCache.invalidateEntries(slowestReaderPos);
    }

    // Remove entries older than the cutoff threshold
    entryCache.invalidateEntriesBeforeTimestamp(maxTimestamp);
}

According to this implementation, all cached entries before the inactive cursor would be evicted (managedLedgerCursorBackloggedThreshold controls whether the cursor should be considered inactive). This data eviction strategy was not applicable to our use case: we had a large number of consumers with different consumption rates and they needed to restart frequently. After caches were evicted, those consuming messages at lower rates had to go deeper to bookies, thus increasing the bandwidth pressure within the cluster.

An engineer from Tencent also found this issue and proposed the following solution:

void doCacheEviction(long maxTimestamp) {
    if (entryCache.getSize() <= 0) {
        return;
    )

    PositionImpl evictionPos;
    if (config.isCacheEvictionByMarkDeletedPosition()) {
        evictionPos = getEarlierMarkDeletedPositionForActiveCursors().getNext();
    } else {
        // Always remove all entries already read by active cursors
        evictionPos = getEarlierReadPositionForActiveCursors();
    }
    if (evictionPos != null) {
        entryCache.invalidateEntries(evictionPos);
    }
    // Remove entries older than the cutoff threshold
    entryCache.invalidateEntriesBeforeTimestamp(maxTimestamp);
}

This implementation tweaked the logic by caching any backlogged message according to markDeletePosition. However, the cache space would be filled up with cached messages, especially when consumers restarted. Therefore, we made the following changes:

void doCacheEviction(long maxTimestamp) {
    if (entryCache.getSize() <= 0) {
        return;
    }

    if (factory.getConfig().isRemoveReadEntriesInCache()) {
        PositionImpl evictionPos;
        if (config.isCacheEvictionByMarkDeletedPosition()) {
        PositionImplearlierMarkDeletedPosition = getEarlierMarkDeletedPositionForActiveCursors();
            evictionPos = earlierMarkDeletedPosition != null ? earlierMarkDeletedPosition.getNext() : null;
        } else {

            // Always remove all entries already read by active cursors
            evictionPos = getEarlierReadPositionForActiveCursors();
        }
        if (evictionPos != null) {
            entryCache.invalidateEntries(evictionPos);
        }
    }
    
    // Remove entries older than the cutoff threshold
    entryCache.invalidateEntriesBeforeTimestamp(maxTimestamp);
}

Our strategy is to exclusively cache messages within a specified period to the broker. This method has improved cache hits remarkably in our scenario, as evidenced by Figure 8. The cache hit percentage of most brokers increased from around 80% to over 95%.
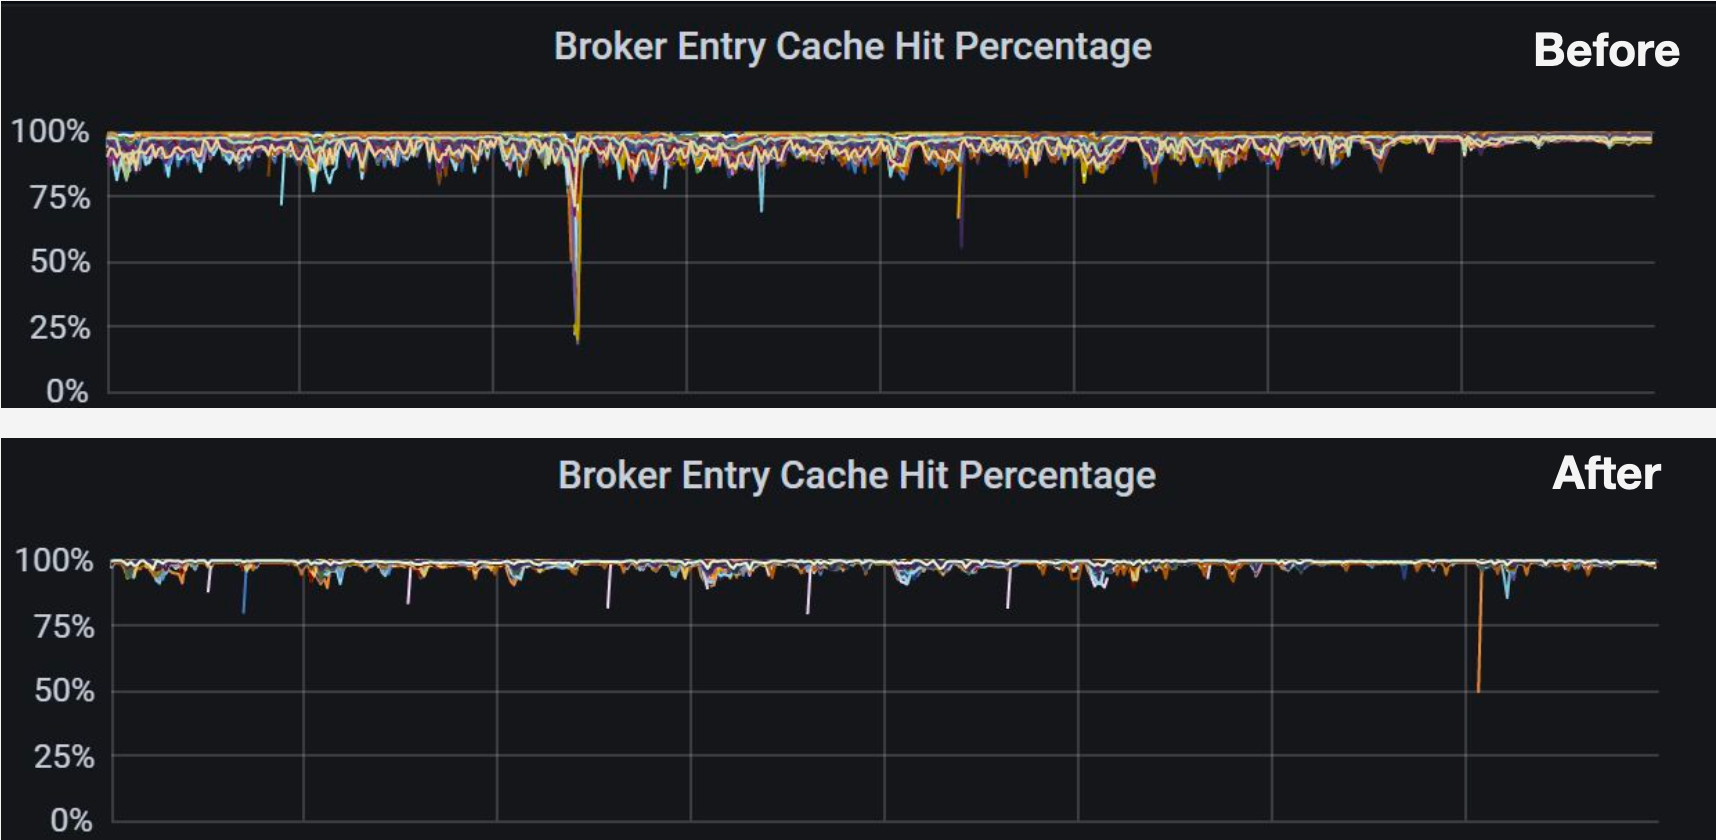
Figure 8. Broker entry cache hit percentage before and after optimization

Practice 5: Creating a COS offloader using tiered storage

Pulsar supports tiered storage, which allows you to migrate cold data from BookKeeper to cheaper storage systems. More importantly, such a movement of data does not impact the client when retrieving the messages. Currently, the supported storage systems include Amazon S3, Google Cloud Storage (GCS), Azure BlobStore, and Aliyun Object Storage Service (OSS).
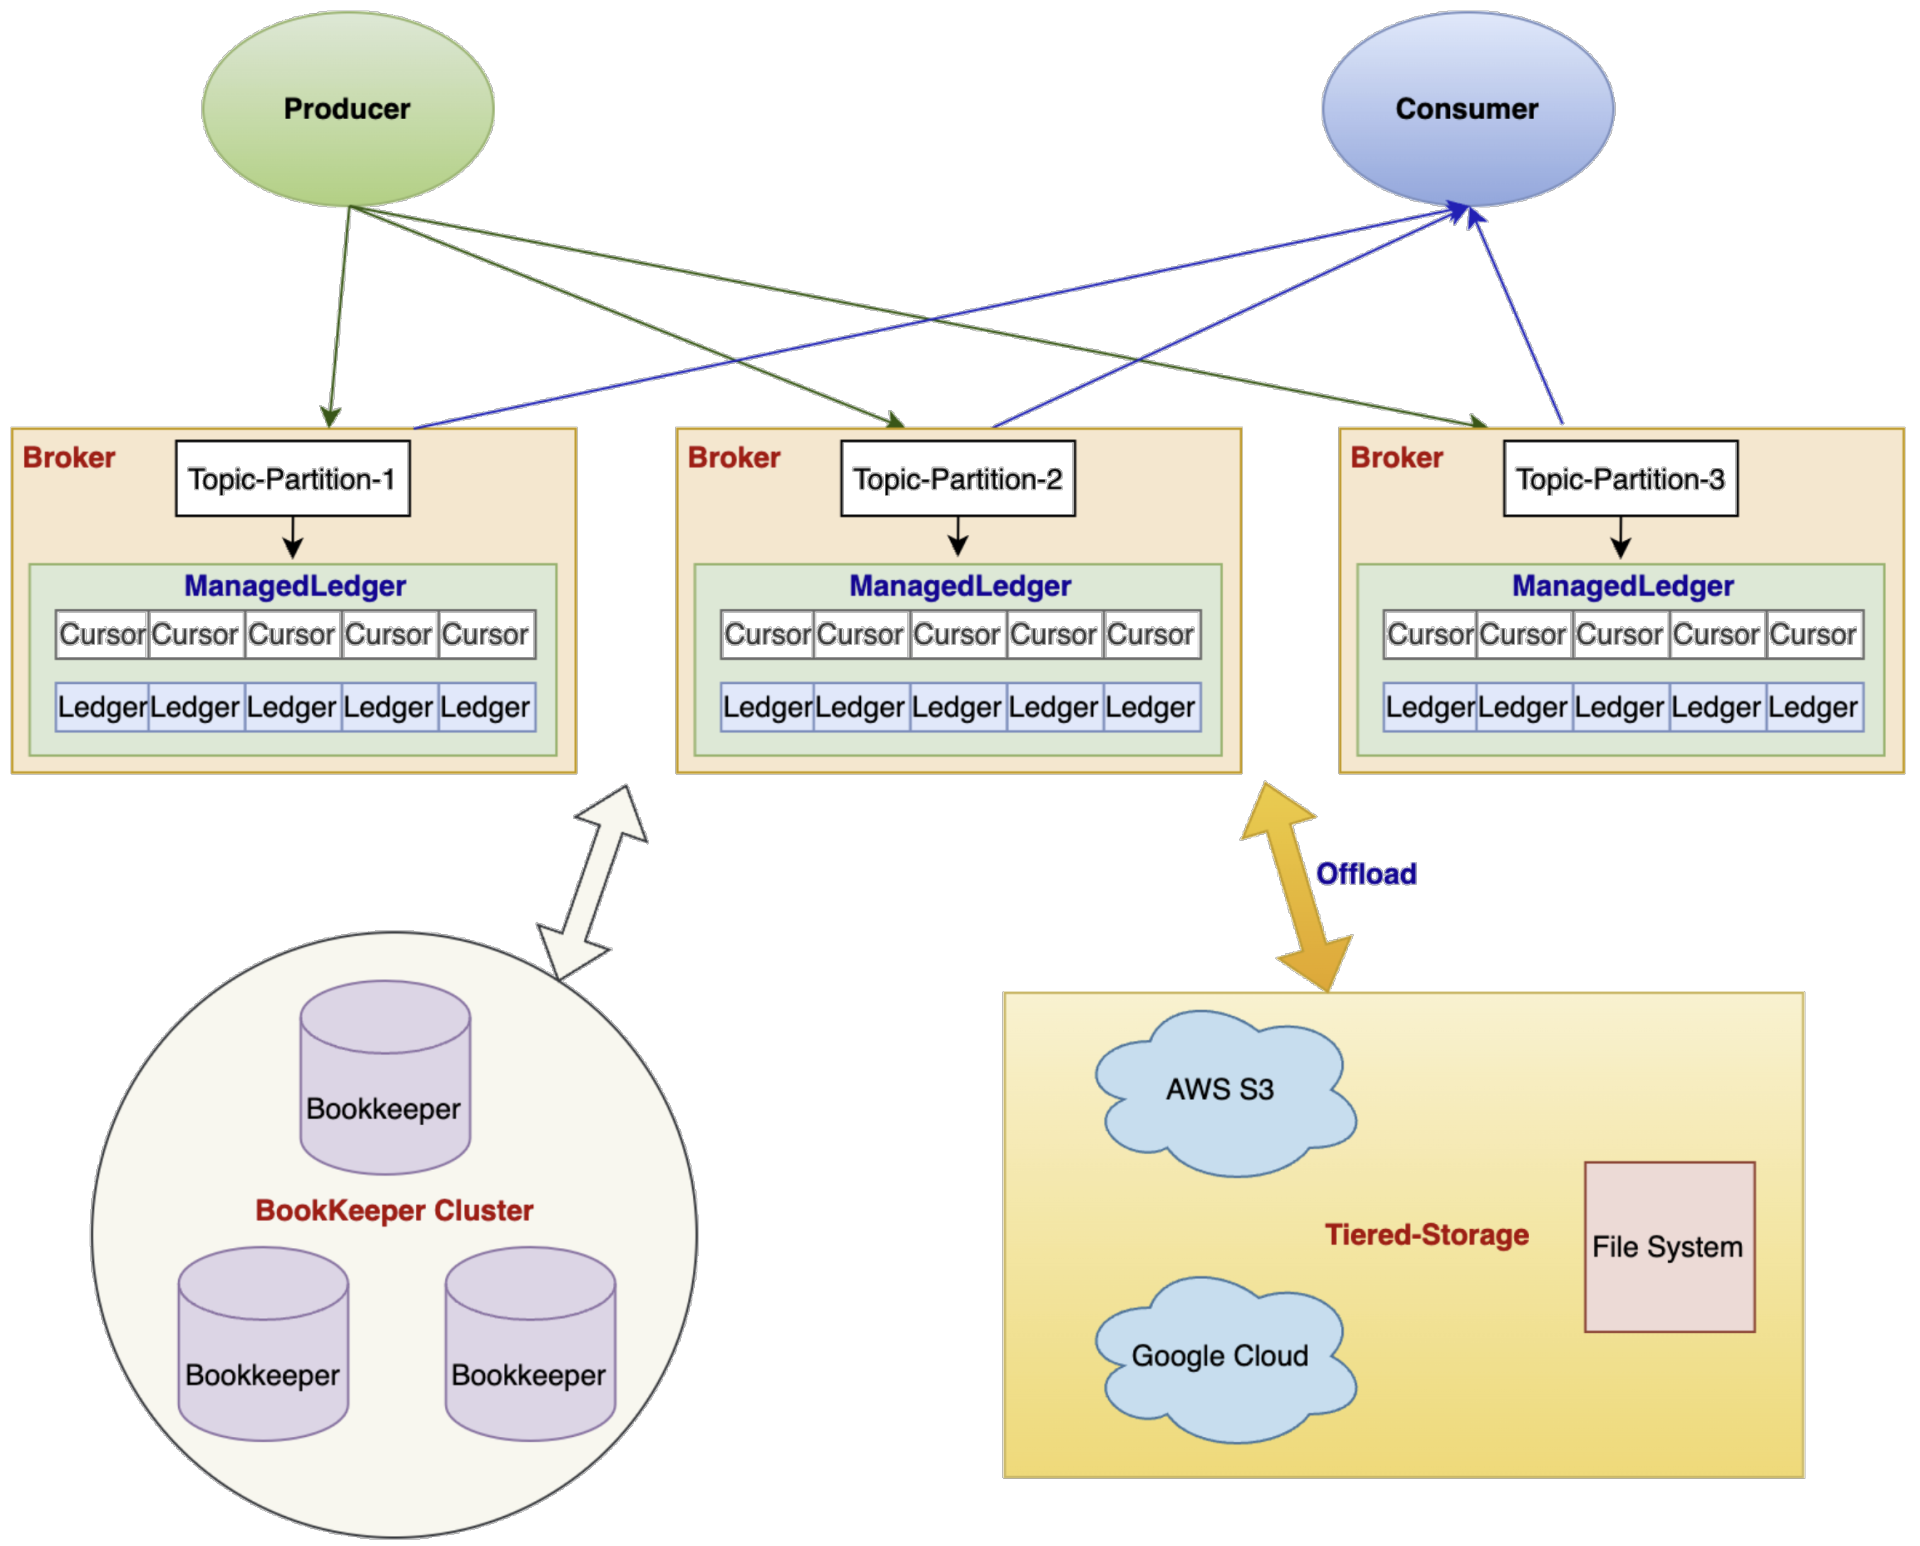
Figure 9. Tiered storage in Apache Pulsar

Our main reasons for adopting tiered storage include the following:

  • Cost considerations. As mentioned above, we are using SSDs for journal and ledger storage on bookies. Hence, it is a natural choice for us to use a storage solution with less hardware overhead.
  • Disaster recovery. Some of our business scenarios require large amounts of data to be stored for a long period of time. If our BookKeeper cluster failed, our data would not be lost given the redundancy stored on the external system.
  • Data replay needs. We need to run offline tests for some of the business modules, such as the recommendations service. In these cases, the ideal way is to replay topics with the original data.

As the Pulsar community does not provide a Tencent Cloud Object Storage (COS) offloader, we created a purpose-built one to move ledgers from bookies to remote storage devices. This migration has decreased our storage costs significantly, so we can store a larger amount of data with longer duration for different scenarios.

Future plans

We are pleased to make contributions to Apache Pulsar, and we would like to thank the Pulsar community for their knowledge and support. This open-source project has helped us build a fully-featured message queuing system that meets our needs for scalability, resource isolation, and high throughput. Going forward, we’d like to continue our journey with Pulsar mainly in the following directions:

  • Get more involved in feature improvements, such as new load balancer implementation (see PIP 192), and shadow topics to support read-only topic ownership (see PIP 180).
  • Integrate Pulsar with data lake solutions.
This is some text inside of a div block.
Button Text
Picture of Shen Liu from streamnative
Shen Liu
Shen Liu is an Apache Pulsar Contributor and a Senior Software Engineer at the Tencent WeChat team.

Related articles

Jan 9, 2025
20 min

Integrating StreamNative's Ursa Engine with PuppyGraph for Real-Time Graph Analysis

Jan 9, 2025
10 min

[Press Release] StreamNative Earns 50 Best Startup Places to Work in San Francisco on Built In’s Best Places to Work List

No items found.

Newsletter

Our strategies and tactics delivered right to your inbox

Thank you! Your submission has been received!
Oops! Something went wrong while submitting the form.
Pulsar Adoption Stories