Introduction to Yum China
Yum China is the largest restaurant company in China with a mission to make every life taste beautiful. The company has over 400,000 employees and operates nearly 13,000 restaurants under six brands across 1,800 cities in China. KFC and Pizza Hut are the leading brands in the quick-service and casual dining restaurant spaces in China, respectively. Taco Bell offers innovative Mexican-inspired food. Yum China has also partnered with Lavazza to develop the Lavazza coffee shop concept in China. Little Sheep and Huang Ji Huang specialize in the Chinese cuisine.
Yum China has a world-class, digitalized supply chain which includes an extensive network of logistics centers nationwide and an in-house supply chain management system. Its strong digital capabilities and loyalty program enable the company to reach customers faster and serve them better. Yum China is a Fortune 500 company with the vision to be the world’s most innovative pioneer in the restaurant industry.
Choosing Apache Pulsar: Great scalability and low operational costs
Yum China’s journey with Apache Pulsar began in 2019, when the company aimed to build a message queue (MQ) PaaS platform for internal usage. At that time, the primary requirements for this platform were horizontal scalability and low operational costs.
After a thorough evaluation of some popular solutions, the company concluded that Pulsar, with a decoupled design principle, would better suit their needs in terms of scalability and operational costs. Additionally, Pulsar’s ongoing development and active community, along with its features like flexible subscription types (Exclusive, Failover, Shared, and Key-Shared), guaranteed message delivery, low publish latency and end-to-end latency, and seamless geo-replication, made it an attractive choice for Yum China.
“All these features offered by Pulsar are the reasons that finally led us to choose Pulsar and we are happy with this decision ever since,” said Chauncey Yan, Backend Software Engineer at Yum China.
Tailoring Pulsar clusters for business and operational data
At Yum China, the traffic served by its MQ system could be broadly divided into two categories:
- Core business data: Requires strong data integrity, high throughput, and low publish latency. Cost-effectiveness is not a priority for this category.
- Operational data: Consists of monitoring metrics, which are essentially ephemeral, so data integrity and latency are less important. Cost-effectiveness is a crucial consideration for this category, as Yum China needs to handle a vast number of monitoring metrics with a relatively small hardware setup.
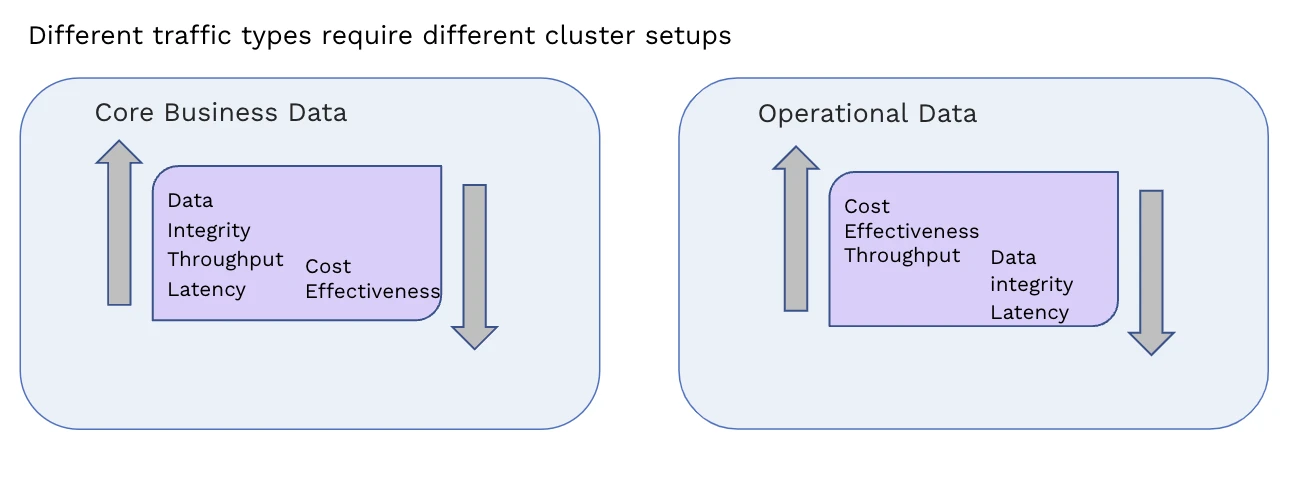
Yum China decided to set up two separate Pulsar clusters to cater to the distinct requirements of its business and operational data. There are four major differences between the Business cluster and the Ops cluster.

- Cluster size: The Business cluster has 26 nodes, while the Ops cluster has 10 nodes. The larger size of the Business cluster means higher throughput for core business data.
- Send method: The Business cluster uses synchronous send, while the Ops cluster uses asynchronous send. Asynchronous send offers better publish latency and overall throughput. However, when calling the async send method, the Pulsar client puts messages into a local send queue, which wait to be sent in batch to the Pulsar server; this may result in message loss during service crashes or power failures. In contrast, the synchronous send method ensures the durability of writes, so it is more suitable for the Business cluster while it is at the cost of latency and throughput.
- Quorum setting: The Business cluster has a write quorum of 3 and an ack quorum of 2, guaranteeing at least one copy of every message. In contrast, the Ops cluster does not require replication, as monitoring metrics are ephemeral.
- Journal write behavior: In the Business cluster, journal sync is enabled, ensuring data persistence to the hard drive before write requests return. In the Ops cluster, journal sync is disabled, allowing data to be written to the operating system page cache. In the event of a power failure or system reboot, messages in the page cache will not be able to get flushed into the hard drive, and therefore entries will be lost. As a result, journal sync is enabled for the Business cluster while it is disabled for the Ops cluster.
Note: When a client writes a message to Pulsar, it is stored in two places in BookKeeper - a journal file and a ledger file. The journal provides a recovery mechanism and the ledger is where the message is actually persistent and clients will read it later.
“With this setup in the Business cluster, we successfully solved the throughput issue with horizontal scalability and achieved data durability. That said, some of these configurations can increase latency,” Yan added. “For the Ops cluster, we threw away all guarantees for data durability but the throughput still remains a very challenging problem.”
More details about how Yum China lowered latency in the Business cluster and maximized throughput in the Ops cluster will be given later.
Use cases: How Pulsar powers internal applications
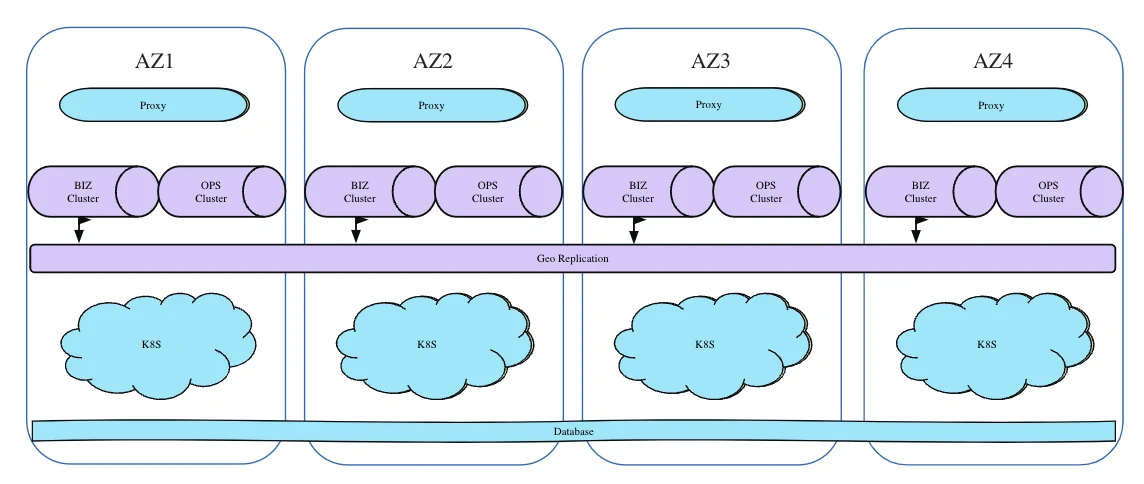
Yum China’s infrastructure consists of four availability zones (AZs), each running a complete copy of its working system. In each AZ, Yum China deployed two Pulsar clusters, one for the Business cluster and one for the Ops cluster. The Business clusters are connected through a geo-replication namespace. Based on this architecture, Yum China has developed several services for its internal use cases.
Nightingale
A component inspired by the open-source project Prometheus Kafka adapter, Nightingale receives a Prometheus remote write (see the following code snippet), extracts the time series field, reformats the time series data into a customized format, and sends it asynchronously to the Pulsar Ops cluster.
message WriteRequest {
  repeated prometheus.TimeSeries timeseries = 1 [(gogoproto.nullable) = false];
  reserved  2;
  repeated prometheus.MetricMetadata metadata = 3 [(gogoproto.nullable) = false];
}
“We use Prometheus to store all of our monitoring metrics and we want them as stream data so that our big data engineer could analyze streams and then they will probably make some automatic operational decisions. For that purpose, we developed Nightingale,” Yan explained. “All our monitoring metrics go through Nightingale, so it becomes a case where throughput matters.”

This service is primarily designed to provide high throughput, reaching up to 200,000 messages per second with a three-node setup.
Pigeonhole
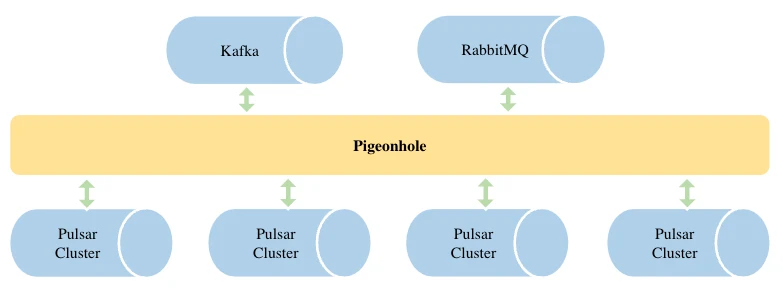
Pigeonhole is designed to replicate messages between heterogeneous systems, such as Kafka and RabbitMQ. It allows developers to focus on handling actual messages with only one consumer type, like a Pulsar consumer. This service also requires high throughput, achieving up to 50,000 messages per second per node with the same optimization logic in Nightingale.
Sonic
Sonic is a SaaS solution designed to synchronize Redis commands across different AZs. Sonic receives Redis commands from clients, wraps them with additional information, and sends them to a Pulsar replicated topic. Instances in other AZs consume these messages, unwrap them, and execute the Redis commands in their local Redis cluster. With this setup, Redis commands are broadcast to all AZs. Latency represents a crucial performance metric in this use case.
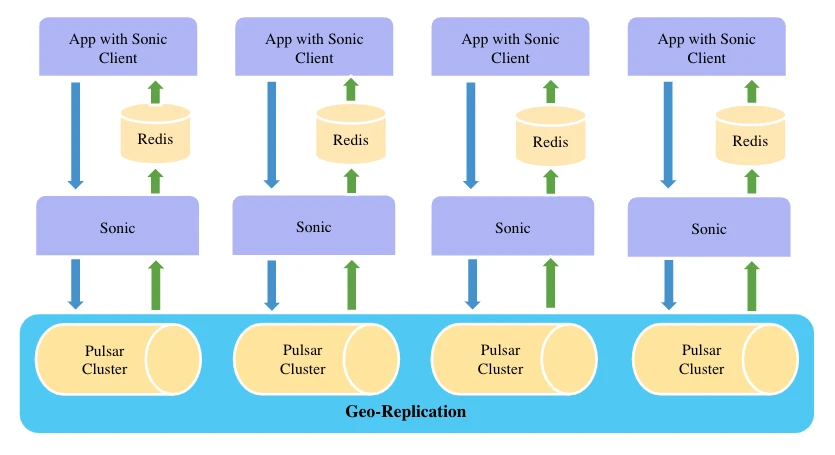
“With the help of Pulsar’s geo-replication feature, we developed Sonic and freed ourselves from the trivial details of data durability arrangement and replication,” Yan said.
Eventbridge
Eventbridge is a PaaS solution for gathering events from Yum China’s cloud system. Eventbridge has three key components:
- A Preprocessor that accepts incoming events and puts them to a Pulsar Eventbridge topic;
- A Rule Engine that consumes the Eventbridge topic, matches events with subscription rules, and puts them in the send topic;
- An Event Processor consumes the send topic and sends events to subscribers.
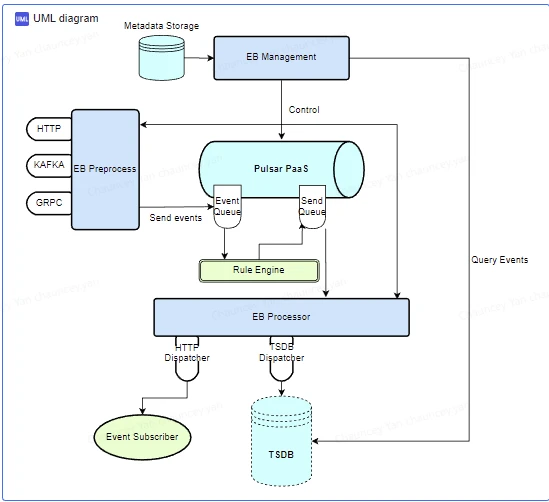
“In EventBridge, different subscription types of Pulsar help us provide different levels of guarantees for each subscriber,” said Yan. “We use a combination of send methods together with different subscription types to ensure event ordering and persistence.”
Tuning performance for low latency and high throughput
When creating and using the above tools in addressing various internal requirements, Yum China worked out some performance-tuning strategies for low latency and high throughput.
Reducing latency for the Business cluster
To achieve low latency for the Business cluster, Yum China focused on the following three aspects.
Hard drive
Writing entries to a ledger is asynchronous, while writes to a journal file are synchronous and can contribute to higher latency. If journal entry sync is enabled, BookKeeper will do a fsync call for every write, the latency of which heavily depends on the performance of the hard drive.
To benchmark hard drive performance, Yum China used FIO to simulate the process of writing entries to journals.
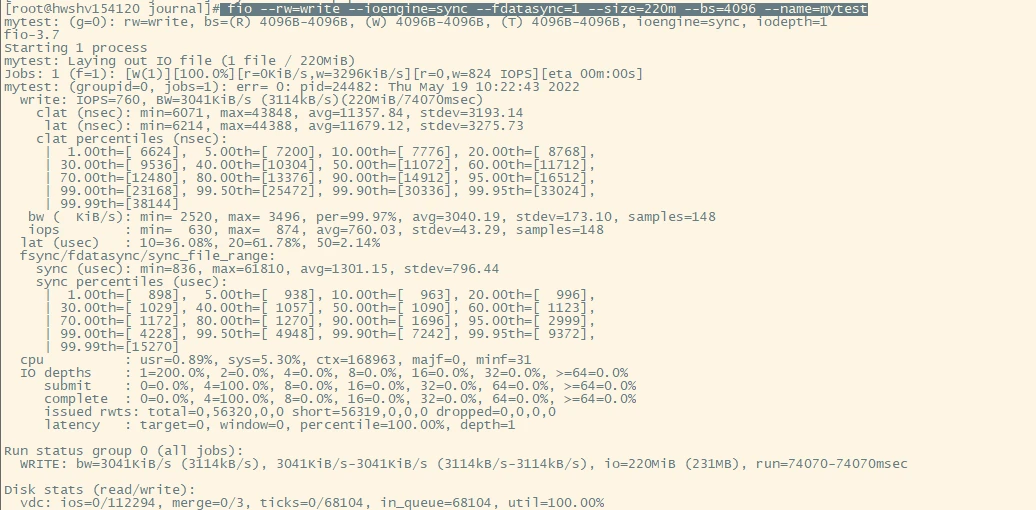
“Based on the results of our FIO benchmark test, we had a discussion with our cloud provider and we believed that the issue lay in network switches,” Yan explained. “So we decided to switch to a local SSD setup, and the result turned out amazing. Our maximum write latency dropped from 300 milliseconds to 5 milliseconds.” Figure 9 shows that the maximum write latency declined dramatically with the local SSD setting.

JVM GC pauses
Yum China has been using the Pulsar Grafana Dashboard provided by StreamNative to monitor cluster metrics, including Garbage Collection (GC) pauses. As shown in Figure 10, the GC Pauses graph displays that the latency can reach 150 milliseconds, which is sub-optimal, especially in cases where low latency is very important.

To reduce the duration of JVM GC pauses, Yan’s team fine-tuned the default JVM configurations of Pulsar by removing the New Gen Size requirement and limiting the GC thread concurrency. See the following two sets of parameters for details.
## Default JVM configurations
-XX:+UseG1GC
-XX:MaxGCPauseMillis=10
-XX:+ParallelRefProcEnabled
-XX:+UnlockExperimentalVMOptions
-XX:+DoEscapeAnalysis
-XX:ParallelGCThreads=32
-XX:ConcGCThreads=32
-XX:G1NewSizePercent=50
-XX:+DisableExplicitGC
-XX:-ResizePLAB

## How Yum China fine-tuned the parameters:
-XX:+UseG1GC
-XX:MaxGCPauseMillis=10
-XX:+ParallelRefProcEnabled
-XX:+UnlockExperimentalVMOptions
-XX:+DoEscapeAnalysis
-XX:ParallelGCThreads=8
-XX:ConcGCThreads=2
-XX:+DisableExplicitGC
-XX:-ResizePLAB"
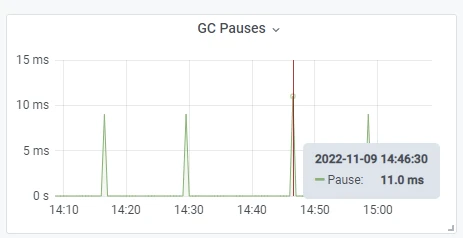
“If you look at the default JVM configuration of Pulsar, it’s actually a throughput-oriented setup. It requires a large New Gen Size and high concurrency for GC threads. This works well under heavy loads but in our case, we don’t have heavy loads and low latency is very important,” Yan noted. “By removing the New Gen Size, our GC pause becomes normal again around 10 milliseconds. Additionally, the maximum publish latency also dropped from 500 milliseconds to 100 milliseconds.”
Internal Pulsar processes
Yum China identified two processes that may lead to higher latency - Auditor periodic checks and entry log compaction.
When using Pulsar, Yan’s team noticed that their cluster had high publish latency in a periodic fashion (at the exact time every week). The latency could sometimes exceed 5 seconds. This led them to check BookKeeper logs, where they found that the AuditorBookie was trying to start a process called checkAllLedgers at the same time point.

The Auditor is one of the elected BookKeeper nodes, responsible for data integrity checks. The checkAllLedgers process, carried by the Auditor node, scans all the ledgers to determine whether the replication matches the write quorum. Unavoidably, this process entails many read and write operations on the hard drive, thus increasing latency.
As the checkAllLedgers check happens once a week by default, Yan’s team decided to set the trigger time at night so it does not impact business. Users can run the following command to reset the auditor’s check time and restart the auditor to load the configuration.
bin/bookkeeper shell forceauditchecks --checkallledgerscheck
Note: Avoid peak hours when you use the command. If you run this command at night, then the process will be triggered at night the next time.
Another process that may cause increased latency is entry log compaction. BookKeeper stores ledgers in an interleaved fashion, so an entry log file may contain data from deleted ledgers and undeleted ledgers. If there are any data from undeleted ledgers, the entry log file itself cannot be reclaimed, causing a waste of storage space. BookKeeper solves this problem by running a separate GC thread. Specifically, it scans all the entry log files’ metadata and filters out those whose remaining data ratios are less than the compaction threshold. After writing them to a new entry log file, it reclaims the old one. This process involves many reads and writes, so it may contribute to higher latency.
There are two types of compaction throttle policies, namely by bytes or by entries. Yan’s team decided to use the isThrottleByByte policy as follows:
isThrottleByBytes=true
compactionRateByBytes=1024*1024*10
“We have taken a series of measures to lower latency for our Business cluster, such as using local SSDs, adjusting GC pause configurations, and fine-tuning internal processes, and we are happy with the results,” Yan said.
Achieving high throughput for the Ops cluster
To achieve maximum throughput, using a synchronous process may not be an ideal solution due to the round trip time. “It is crucial to consider a simple mathematical principle for the synchronous send method,” Yan said. “For example, if your network has a round trip time of approximately 5 milliseconds, the total throughput of your service will be no more than 200. Therefore, we need to use the asynchronous send method to fill up the water pipe.”
Figure 13 shows how Pulsar handles the same asynchronous call. By invoking the asynchronous send method, the client puts messages into a local send queue. Subsequently, an IO thread, triggered by certain conditions, accumulates and dispatches the messages in batch. This way, the looping IO thread keeps sending messages, optimizing bandwidth utilization and maximizing throughput.

Yan’s team proposed the following configurations on the client side, which allowed them to send 46,000 messages per second per node with Nightingale.
# The size of the send queue
MaxPendingMessages = 1000

# How long the earliest message waits in the queue
BatchingMaxPublishDelay = 1ms

# Compression type and level
CompressionType = LZ4
CompressionLevel = high

# Limit the size of batch messages
BatchingMaxMessages = 100 * 1024
BatchingMaxSize = 10 MB
Lessons learned
Yan shared two cases when using Pulsar and summarized what they learned from them.
A blocked consumer
Yan’s team has a service triggered by HTTP requests. Once triggered, it will get or create a consumer and receive all the messages in the subscription backlog. After consuming all the messages, the consumer will stop working and the HTTP call will be returned.
One day they found the service stopped consuming messages even though there were still messages in the backlog. “The gotcha here is that Pulsar pushes messages to your consumer local queue. By calling the receive function, the consumer takes messages from this receiver queue,” Yan said. “If your consumer does not call the receive method, messages will stay in the queue and no other consumer will be able to consume them.”
func HandleHTTP() {
consumer = GetOrCreateConsumer()
while true {
msg = consumer.ReceiveWithTimeout()
}
  ++ consumer.Close()
return
}
“Now that we know the reason, the fix is very simple. Just close your consumer if you don’t need it anymore,” Yan added.
A crashed consumer
The default receiverQueueSize is 1,000 messages, which can lead to memory issues if the backlog and message size are too large.
“During load tests, our service just kept crashing with OOM errors when the consumers starts,” Yan said. “It turned out it was an issue with the receiver queue. To avoid OOM errors during heavy loads, you need to carefully manage the receiver queue size.”
Future plans
Yum China’s Pulsar-backed PaaS system has evolved significantly, but the organization still has plans for further improvements:
- Pulsar on Kubernetes: To embrace cloud-native practices, Yum China plans to migrate its Pulsar workloads to Kubernetes. This will be a continuous process, as many critical services currently depend on Pulsar running on virtual machines.
- Infrastructure as Code (IAC): Yum China plans to implement an IAC setup to manage its Pulsar configurations, potentially using the Terraform provider for Pulsar developed by StreamNative.
More on Apache Pulsar
Pulsar has become one of the most active Apache projects over the past few years, with a vibrant community driving innovation and improvements to the project. Check out the following resources to learn more about Pulsar.
- Try StreamNative Cloud to use fully managed Pulsar services in the cloud of your choice.
- Start your on-demand Pulsar training today with StreamNative Academy.
- Adoption Story From Kafka to Pulsar: Creating A Comprehensive Middleware Platform to Power HUAWEI Mobile Services
- Adoption Story Supporting 100+ Products: iFLYTEK Improves SRE Efficiency with Apache Pulsar


